Analytical Query Performance on Supabase Postgres
Postgres row storage makes analytics slow; here's how to diagnose and fix it.
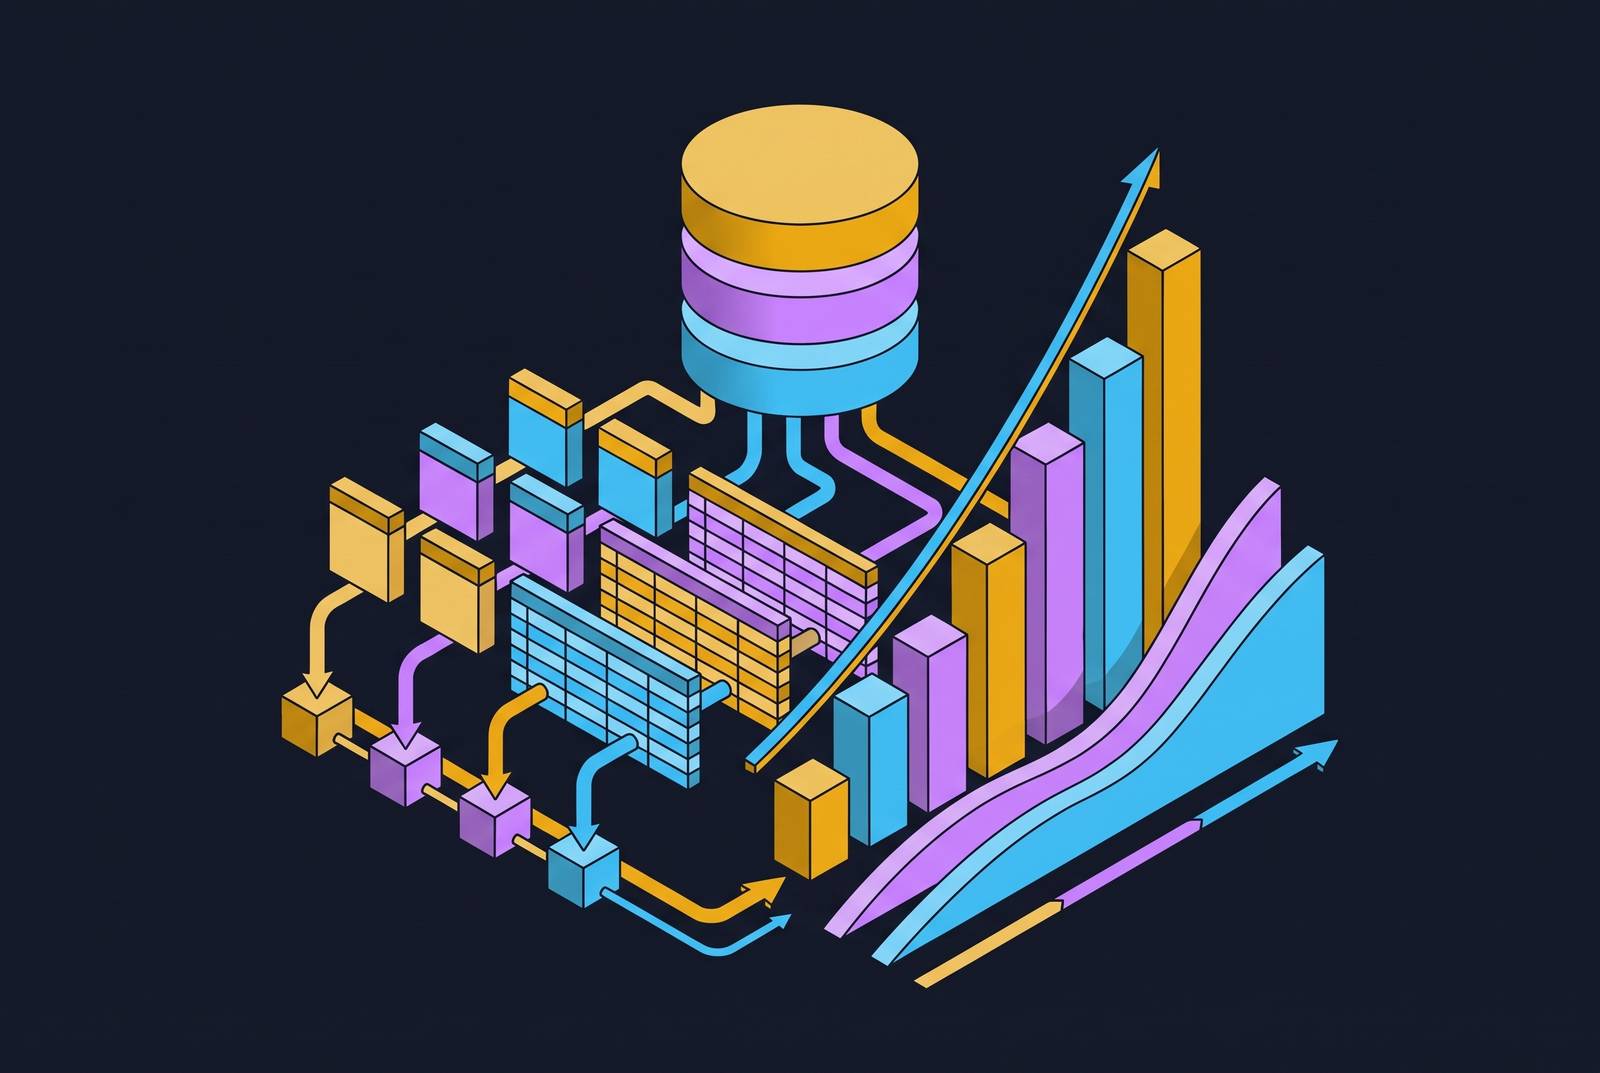
Supabase Postgres is built as a row-oriented OLTP engine, optimized to look up a single customer record, insert a new order, or update a profile field as fast as possible. Analytical queries ask it to do something close to the opposite: scan and total up millions of rows at once, which is exactly the job a row-oriented engine is poorly shaped to do.
The gap comes down to how the engine stores and reads data. A row-oriented system keeps every column of a record together on disk, so pulling one record back is cheap: one read gets the whole row. But add up a single column across a million rows, and the engine still has to pull every full row off disk to get at that one field, dragging along data nobody asked for. A columnar engine stores each column apart from the others, so a sum or an average only touches the column it needs. Postgres doesn't work that way, and that single fact explains most of what follows.
The other hard limit is memory. When the data a query touches fits inside available memory, Postgres runs fast, often fast enough that the mismatch barely shows. Once the query's working set grows past that ceiling, Postgres starts spilling to disk, with query times climbing fast once that happens. None of this points to a flaw in Supabase. It is a strong application database, doing precisely the job an application database is supposed to do. The trouble starts when a team asks that same database to also carry the analytics layer.
Four specific ways the production Postgres setup breaks when analytics are added
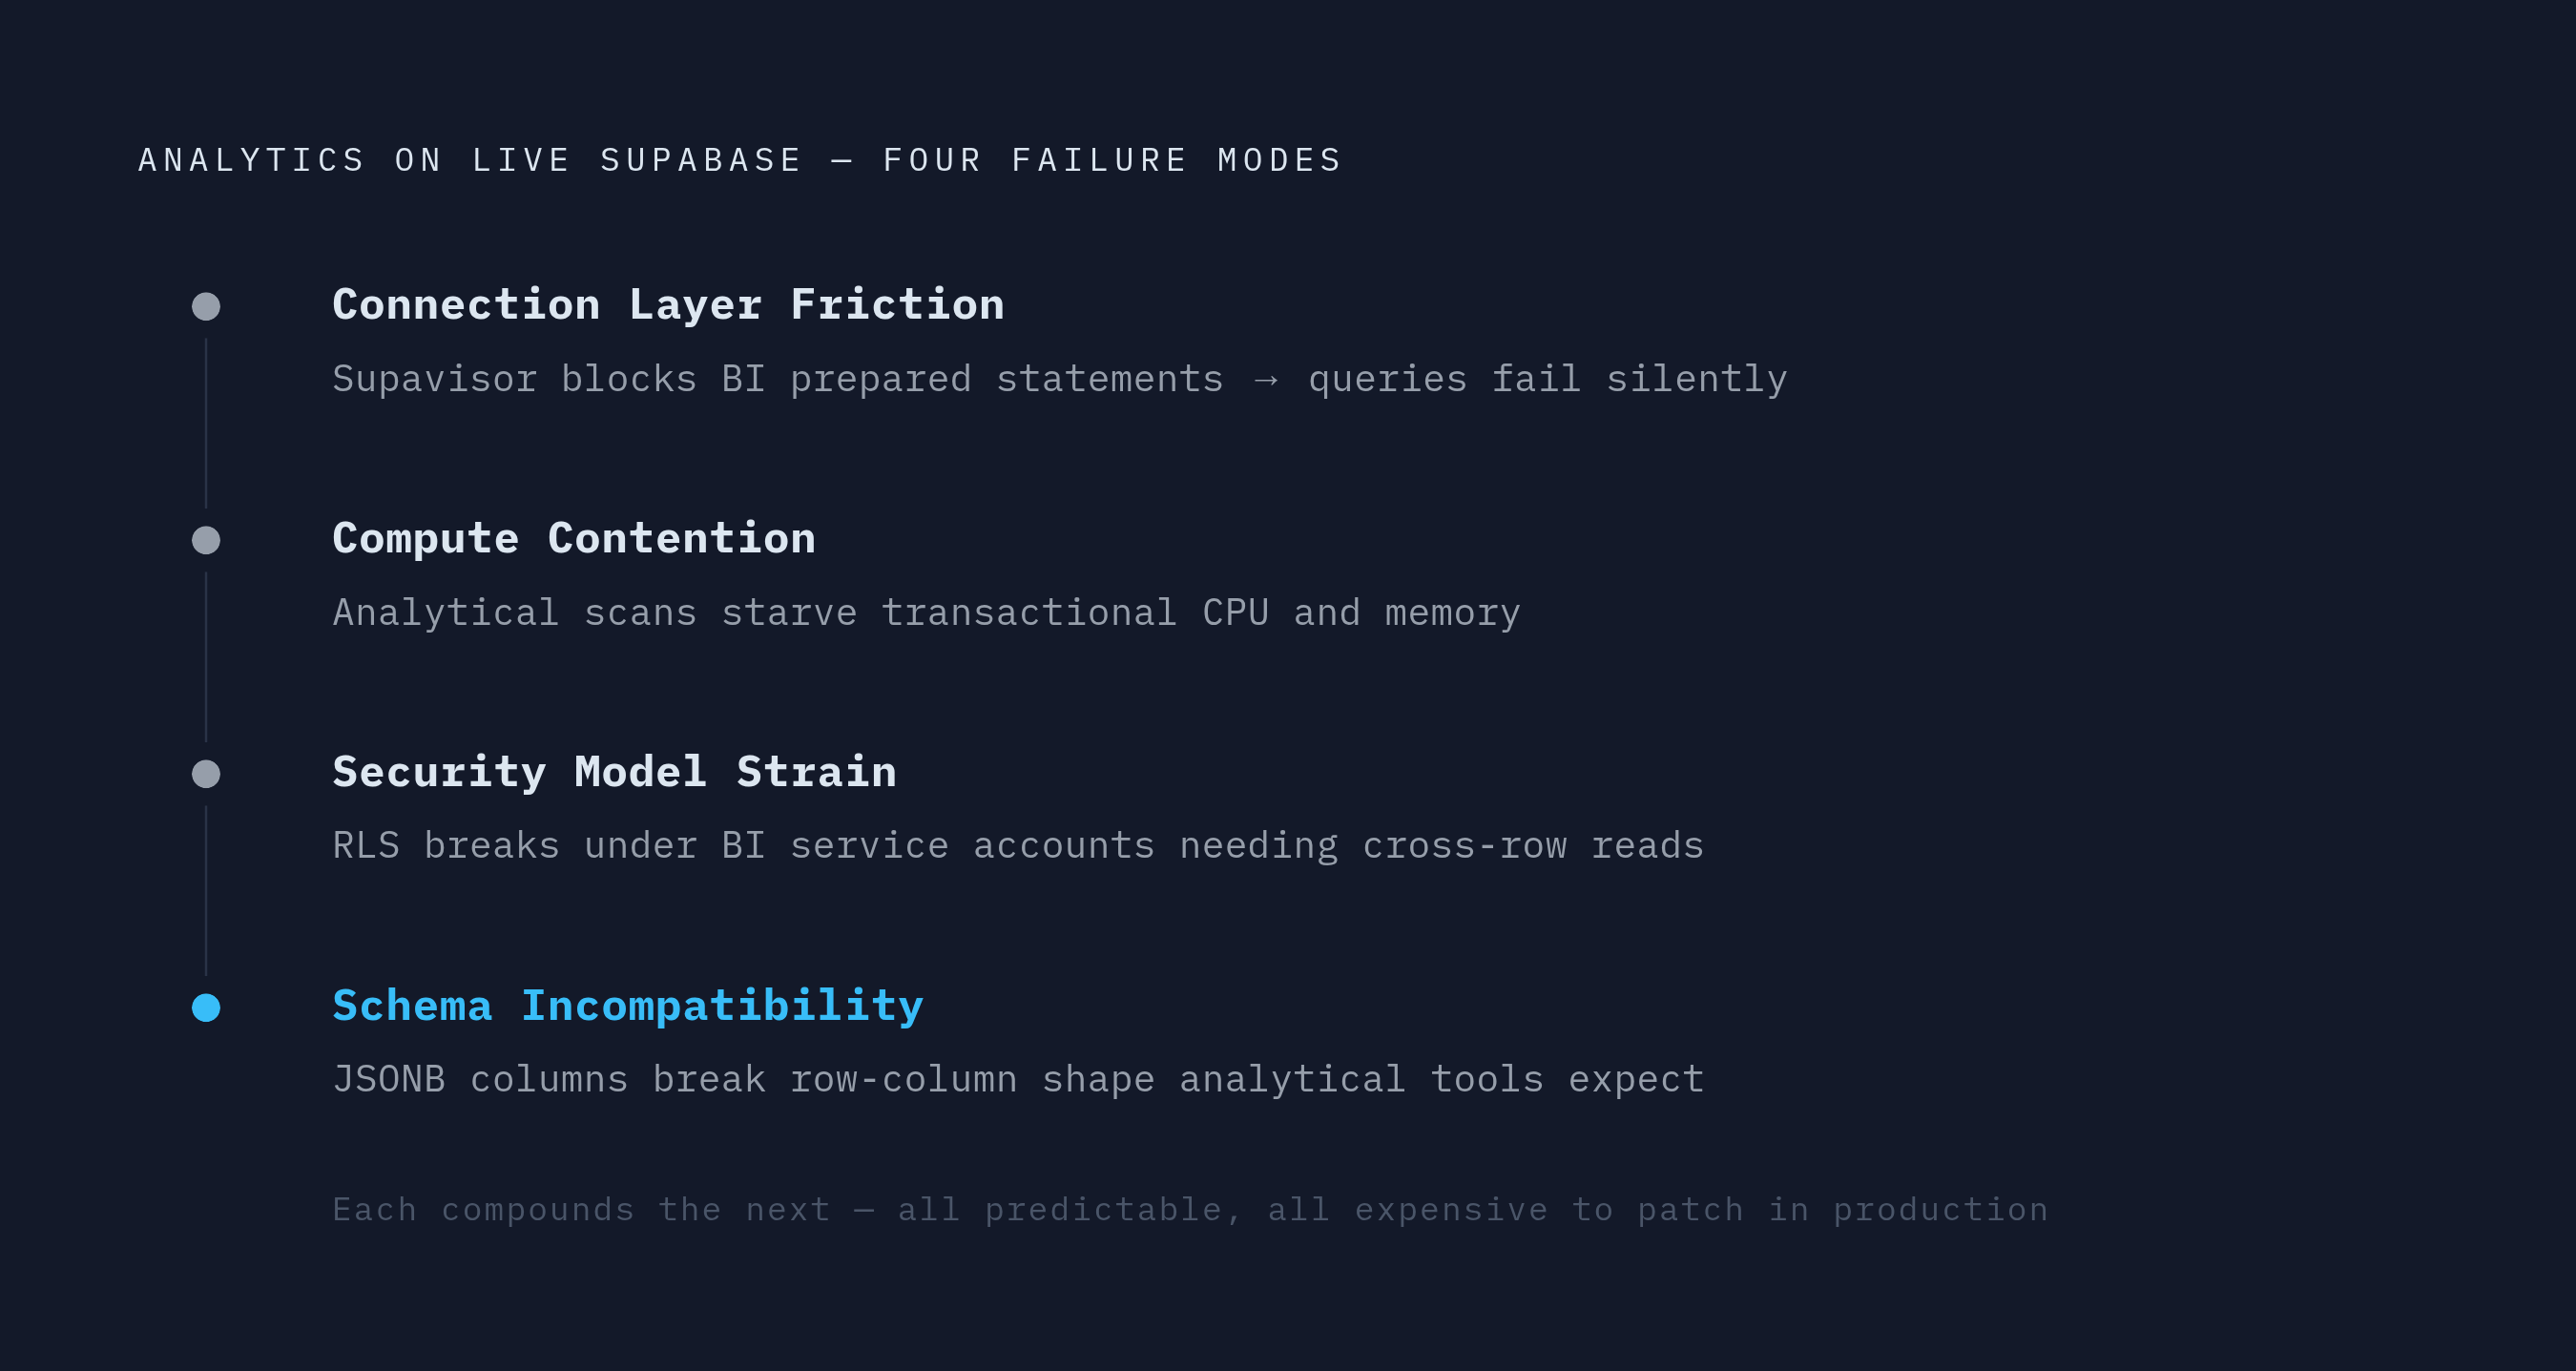
Running analytics against a live Supabase production database doesn't produce one vague slowdown. It produces four separate, predictable breakdowns, and each one gets expensive to patch once it's live.
The first is friction at the connection layer. Supabase's connection pooler, Supavisor, runs in transaction mode by default, built for short connections that open, do their work, and close. That mode doesn't support prepared statements, which most BI tools depend on to run. Switching to session mode or connecting directly solves that problem but introduces another: those connections sit open against the same database serving live app traffic. On top of that, direct connections use IPv6 by default, and reaching them over IPv4 means paying for an add-on.
The second is compute contention. Analytical queries scan and total rows across wide swaths of a table, the exact job columnar engines exist to do well, and on Supabase that work runs on the same CPU and memory as the live transactional traffic. Users feel it as a slower app. The team running the database feels it as pressure to buy a bigger instance, an upgrade that serves the BI tool's demands at the expense of the people using the product.
The third is strain on the security model. Production row-level security policies are written around a single user's auth context, correct for a logged-in customer, wrong for a BI service account that needs to read across every row. Teams respond by granting a role that skips RLS entirely or by writing analytics-shaped rules into the production auth model. Neither sits well in a system meant to keep one user's data separate from another's.
The fourth is schema incompatibility, particularly around JSONB. Columns built to hold flexible, semi-structured app data don't line up cleanly with the row-and-column shape analytical tools expect, so queries written for reporting often fight the schema.
How to find which queries are causing the problem
The place to start is letting pg_stat_statements rank the entire workload by what it actually costs, because the queries a team assumes are expensive and the queries actually burning the most time rarely match.
pg_stat_statements ships with Postgres and runs by default on every Supabase project, with no separate install step, and it can be switched on through the Supabase dashboard if it's somehow off. It keeps a running tally of every query the server executes, grouped by shape, and that tally answers two different questions depending on how it's sorted. Sorting by total_exec_time surfaces the queries costing the most in aggregate, the right view when the database is under heavy CPU load and the goal is cutting the biggest resource draws. Sorting by mean_exec_time instead surfaces queries that are slow on a per-call basis, the right view when one specific feature or page feels sluggish to users even though it doesn't rank high in total cost.
Timing matters here too. Running SELECT pg_stat_statements_reset(); at deploy time, then letting an hour or so of real traffic build back up, gives a clean before-and-after read on whether a change helped. Without that reset, the view only shows the system's current state. A regression that shipped last week just reads as the new normal.
pg_stat_statements has a real limit: it's a running tally with no memory of its own history. A regression is visible only while it's actively happening, and the view never stores the actual execution plan behind a query, so it shows that something got slower without saying why. Tools like pganalyze close that gap by connecting to the database over the network and collecting query and schema statistics continuously, giving a team the ability to look back at a regression after the fact. Running it calls for a collector on infrastructure the team controls, pointed at the Supabase connection string, with a stable and publicly reachable address needed only if log collection runs through the collector's OTLP endpoint.
Reading EXPLAIN (ANALYZE, BUFFERS) output to understand why a query is slow
Once pg_stat_statements has named the query worth chasing, EXPLAIN (ANALYZE, BUFFERS) shows what Postgres actually does to run it, and the buffer counts in that output point straight at disk I/O as the thing driving the cost.
There are three layers to this, each adding more information than the last. Plain EXPLAIN asks the query planner what it intends to do without running the query at all, useful mainly for a quick check on whether a query is going to hit an index or not. EXPLAIN ANALYZE goes further: it actually runs the query and reports real row counts and real timings next to the planner's estimates. The distance between the estimated row count and the actual one is often where a bad plan hides, since a planner working from stale statistics will choose the wrong strategy.
Adding BUFFERS to that command shows how many pages were read from the shared buffer cache versus pulled from disk. A plan with a high count of buffer reads against disk, rather than cache, is spending its time on I/O rather than computation, and that distinction is the one that actually explains why a query feels slow. The most common pattern behind that number is a sequential scan on a table that's grown large over time, caused by an index that once covered the table well enough but no longer exists, or never did, so every query now walks the full table to find its rows. Adding the right index to that same query shrinks the disk reads dramatically, often eliminating nearly all of the I/O the original plan required.
Indexes, materialized views, and pg_cron as mitigations that work within Postgres
For a wide range of slow-query problems, the fix is a better-shaped index or a result that's already been computed, tools Postgres ships without needing anything bolted on.
CREATE INDEX CONCURRENTLY is the fix behind most of these wins, and it applies without locking out writes while it builds, so it can run against a live production table. Supabase Studio's Query Performance Report includes a tool called index_advisor that recommends indexes for a specific query, handles generic parameters and materialized views, finds tables and columns hidden behind view definitions, and skips suggesting an index that already exists. Beyond single-column indexes, partial indexes cut down on size and upkeep when a query always filters on the same condition, and composite indexes serve queries that filter and sort across more than one column at once.
Materialized views solve a different piece of the problem: pre-computing a heavy aggregation once and storing the result as a table a dashboard can read instantly, rather than re-running the full scan every time someone loads the page. The cost is staleness. A materialized view only reflects data as of its last refresh, which is a fine trade for a dashboard that updates daily or hourly and a bad one for anything that needs to reflect what happened a minute ago. pg_cron closes that gap by scheduling the refresh itself, timed for off-peak hours so the recompute isn't competing with daytime transactional load.
These tools carry a team further than most expect, solving a large share of slow-query complaints without adding a single new system. But they only reshape how a query runs inside Postgres. They leave unresolved the deeper architectural contention between analytical and transactional work sharing the same compute, and as analytical demand grows, with more dashboards, more frequent refreshes, and heavier aggregations, the cost shifts into bigger instances and more index upkeep. None of these tools make Postgres data joinable with Stripe, HubSpot, or other CRM data either, so any business question that spans more than one data source stays out of reach no matter how well the indexing is done.
Why upsizing and read replicas both have ceilings
Faced with analytical queries straining a production database, most teams reach for one of two moves: buy a bigger primary instance, or stand up a read replica. Both genuinely ease the pressure. Neither touches the mismatch causing it.
Upsizing buys more memory, which pushes back the point where analytical queries spill to disk, and more CPU, which eases contention between analytical and transactional work. The engine underneath is still row-oriented, and no amount of added memory or CPU changes that fact. The upgrade serves the dashboard, not the people using the app, and the next dashboard someone adds, or the next milestone in table growth, brings the same pressure right back.
A read replica moves analytical traffic off the primary. What it delivers, though, is still a single source of data, still row-oriented, still built for OLTP, with the same JSONB friction and the same inability to join in Stripe or CRM data, running at twice the infrastructure cost. Standing up a replica for analytics quietly concedes the actual point: production Postgres isn't the right home for this workload, and paying to run a second full copy of it doesn't change that, it just confirms it.
Both paths are reasonable responses, and both make sense in isolation. But they spend money to buy a higher ceiling. A team that has already worked through indexing, materialized views, and scheduled refresh, and is now staring down a compute upgrade or a replica bill, has reached the point where offloading the analytical workload is the cheaper option, not the more complex one.
Offloading Analytical Workloads in Practice
Offloading analytical work means replicating the data a team needs into a layer built for aggregation and for joining across sources, not standing up a full warehouse stack. The goal is giving analytical queries a home shaped for what they actually do.
The bar for that layer is fairly simple to state: a columnar-friendly query engine where app data can be joined against external sources, Stripe, a CRM, ad platforms, without first dragging those sources into Postgres. That's the one capability production Postgres structurally can't offer, no matter how well it's indexed or replicated.
Two failure modes sit on either side of that goal, and both are common. On one side, small teams build a full warehouse stack, separate pipeline tooling, a cloud warehouse, a BI layer on top, before their revenue model is even validated, burning runway and taking on operational work a small team can't realistically maintain. On the other side, teams wait until the question is already unanswerable: they reach for analytics only after a campaign has ended or a customer has already churned, at which point the data can only explain what happened.
The right scale depends on the stage a company is actually at. A seed-stage startup rarely needs a dedicated data team. A company at Series A might justify one person focused on data. The tooling decision should track actual analytical demand in front of the team today, not a size the company might reach someday.