Extending Supabase Into a Full Dashboard Backend Without Adding Warehouse Infrastructure
Isolate analytical queries and govern your metrics to skip the warehouse.
Analytics for Supabase teams can run directly on Postgres without a separate warehouse when analytical queries are separated from transactional traffic and metrics are defined in governed datasets. A full dashboard backend combines query routing, shared metric definitions, and controlled access for dashboards, teammates, and AI agents. The central decision is not where to move the data, but how to isolate analytical work and make every consumer read the same definitions.
Why Postgres-native analytics breaks down as dashboards multiply
The product works, users arrive, and a key account asks to see its own data. Nothing exists to serve that request. The first dashboard can query application tables directly, but each new dashboard adds aggregations over large row sets to the database that serves paying customers. Those queries compete with the transactions that keep the product responsive. What began as a reporting feature becomes an application performance problem.
Postgres’s row-based transactional execution and columnar analytical aggregation serve different computational patterns. Heavy aggregations on the production instance can slow the application, while exporting data to a legacy BI tool introduces a different set of compromises. Analytics loses its link to live records, user context needs manual joins, and dashboards are hard to embed.
Smaller teams face this gap particularly sharply. Dresner Advisory Services’ 2024 Embedded BI Market Study finds that the use of embedded analytics is growing fastest among smaller organisations. For a Supabase builder, that demand arrives as a product requirement. Customers want access to their own information without compromising the application they already use.
Why adding a warehouse is not the right first answer for most Supabase teams
A warehouse is premature unless datasets are very large or analytical workloads are genuinely complex. It introduces another system to provision, secure, and maintain, plus ETL or replication pipelines between that system and Postgres. Those pipelines create another failure surface. Production schema changes can silently break them, and replication introduces a delay between a write and its appearance on a dashboard.
That overhead does not settle the initial architectural question. The immediate problem is how analytical queries are routed and what they touch, rather than whether the data has a new home. Query and modeling changes can address that problem without introducing a warehouse. Astrato’s Supabase integration supports a later move by allowing the same dashboards to point at a warehouse if Postgres is outgrown. Starting there is not a prerequisite for building useful analytics now.
Separating analytical workloads at the query layer, not the infrastructure layer
The practical response is to separate the query paths. Supabase supports read replicas, so dashboard queries can run away from the primary instance while production handles transactional traffic. This removes analytical load from the primary without introducing a different database system. It separates execution without requiring a production schema redesign.
An embedded analytical engine offers another mechanism. The open-source PostgreSQL extension pg_duckdb, developed in collaboration with Hydra, MotherDuck, and DuckDB Labs, embeds DuckDB’s columnar-vectorized engine inside Postgres. The setting SET duckdb.force_execution = true; routes queries through that engine. The project reports analytical query acceleration of up to 600x without exporting data.
Faster execution is not the same as resource isolation. The extension remains limited to a single server’s resources, so large queries can still compete with transactions when both run on the same instance. Placement on a replica preserves the separation. For fixed dashboard queries serving stable metrics, materialized views offer a third option that computes results ahead of time so they can be read again and again, though they need a refresh schedule and more storage.
What pre-modeled, governed datasets add that query-layer separation alone cannot
Separating queries helps with performance, but it cannot define revenue. Consider a founder who opens two dashboards before an investor call and finds different Q2 revenue totals. One engineer used SUM(revenue), while another used SUM(amount_captured). Both queries can read the right records and still answer different questions. An AI agent that can read tables directly may interpret them in yet another way.
A governed dataset can encode a rule such as “revenue means collected cash, recognized in the period it was invoiced,” calculate the result ahead of time, and store it for every consumer to read. The definition is then part of the model, so each query author no longer has to remember the rule. Faster SQL alone cannot provide that agreement.
Governed Parquet files queryable through DuckDB are one concrete form of this layer. They are fast to query, cheap to serve, and detached from the production connection pool. Dashboards, analysts, and agents can consume the same calculated results through a common interface. The weekly email and the AI-generated summary then use the same revenue number because neither reconstructs the metric independently.
How a governed data layer serves dashboards, teams, and AI agents from one source
Headless analytics separates analytical logic from any single dashboard interface. Governed datasets are exposed through APIs and an MCP server, allowing BI tools, Slack bots, and AI agents to consume shared definitions without touching production. The interface can change without relocating the meaning of a metric. This makes the governed layer useful beyond the dashboard that first required it.
The Model Context Protocol gives them a shared way to access the data. Anthropic introduced MCP in November 2024 and donated it to the Agentic AI Foundation under the Linux Foundation in December 2025. Its common protocol replaces N×M application-to-source connectors with N+M implementations. The 2026-07-28 specification removed protocol-level sessions and the initialization handshake, so requests can reach any server instance behind a round-robin load balancer.
Agents need governed context and limits on their permissions, with Resources and Tools to find datasets and make named requests, plus rate limits and per-agent quotas at the MCP server. Atlan’s 2026 guidance calls for source inventories, row- and column-level policies before connection, governed access instead of direct database credentials, and query auditing. Direct production write access is the critical mistake because an agent bug, unexpected input, or prompt injection can then corrupt production data.
Observability as the prerequisite: what Supabase teams must instrument before analytics can work
A governed analytical layer depends on visibility into production. Without it, teams see performance problems only after they have affected users and have to guess when to scale. Monitoring starts with active connection count relative to max_connections, with immediate attention when usage approaches the danger threshold. A dashboard that leaves out connection pressure cannot show whether analytical access is using up scarce database capacity.
Query latency needs its own view of the system. Tracking p50 and p95 latency makes slow-query behaviour visible rather than leaving the team to infer it from complaints. Realtime channel count also needs monitoring because channel volume eventually requires partitioning to remain manageable. These signals show different limits, so a healthy reading for one says nothing about the others.
Supabase already exposes Prometheus-compatible Postgres metrics refreshed per minute. They include CPU, IO, WAL, connections, and query statistics, leaving dashboards and alerts as the work to build on top. Structured logging and a Prometheus exporter belong in the setup from day one. Their output can feed the governed analytical layer used for business metrics, so people who track operations and those who track the business can use the same layer while keeping their different signals clear.
The metrics a Supabase startup should govern first, and when definitions must change
Before product-market fit, only a few signals are useful. Acquisition, activation, retention, revenue, and referral deserve agreed definitions before a team expands its metric catalog. Tracking more measures before those are stable makes the numbers harder to learn from. Those definitions must be enforced in the modeling layer.
Revenue needs explicit choices about collected cash versus invoiced amounts, gross versus net of refunds, and the recognition period. Investor-facing measures require the same precision. CAC payback, LTV to CAC, gross margin, net revenue retention, and burn multiple cannot be treated as approximate labels. Burn multiple, for example, is net burn divided by net new ARR.
Governance also has to accommodate a changing business. Measures that guide an early-stage company can mislead at a later stage, and the reverse is just as true. Definitions therefore need review when the business changes stage as well as when engineers change the schema. Once the metrics have been calculated, they should reach people through inboxes, Slack, or the dashboards they already check. A shared definition has limited practical value if access depends on someone remembering to request it.
Which BI tools connect directly to Supabase without a warehouse?
The choice of tool depends on who will use the data most. Internal reporting, customer-facing embedded analytics, and agentic access place different demands on permissions, presentation, and metric definitions. A direct Postgres connection is only the first thing to check when choosing a tool. Tool selection requires checking which responsibilities the tool handles and which remain in the underlying architecture.
Astrato connects through a Supabase connection URL and generates optimized SQL for live Postgres queries. Its embedded apps use existing row-level security policies to restrict each customer to their own data, while white-label controls cover colours, fonts, layout, and navigation. MCP connections let Claude, ChatGPT, Codex, and Cortex Code work from shared semantic definitions. PDF, Excel, and PPT reports can run on a schedule for executives, while custom report sandboxes let users build views from dimensions and measures that have been approved.
Draxlr offers another direct connection to Supabase Postgres. It is listed in the Supabase partner catalog and has a visual query builder, a SQL editor, and AI-generated queries based on plain-English questions. Its MCP server lets Claude, ChatGPT, and Cursor read schemas, run read-only queries, and save results to dashboards. Row-level security applies to every request, and teams can share dashboards or embed them with secure filters. This read-only query model is distinct from serving pre-calculated datasets, so production isolation still depends on where analytical queries execute.
When a Supabase team is ready for a data hire versus a fractional partner
Most seed-stage Supabase teams do not need a dedicated data hire to establish governed analytics. Product engineers can instrument the application, operations can use an analytics tool, and a fractional partner can establish the architecture and core definitions. The immediate requirement is clean reporting with accountable metrics.
A useful first month has a deliberately narrow scope. A fractional partner can deliver one critical dashboard connected to a single-source-of-truth metric definition, establishing a working cadence. A mid-market company may instead need more help with BI and more formal rules for governance. The scope follows the reporting and maintenance needs.
The governed layer reduces dependence on its original builder. Once definitions are in pre-modeled datasets and a semantic layer, teammates and agents can use them through the access interface without asking a data specialist to help with every query. The governed layer makes ownership and maintenance less dependent on repeatedly explaining and reconstructing the same calculations.
What a full dashboard backend on Postgres actually looks like end to end
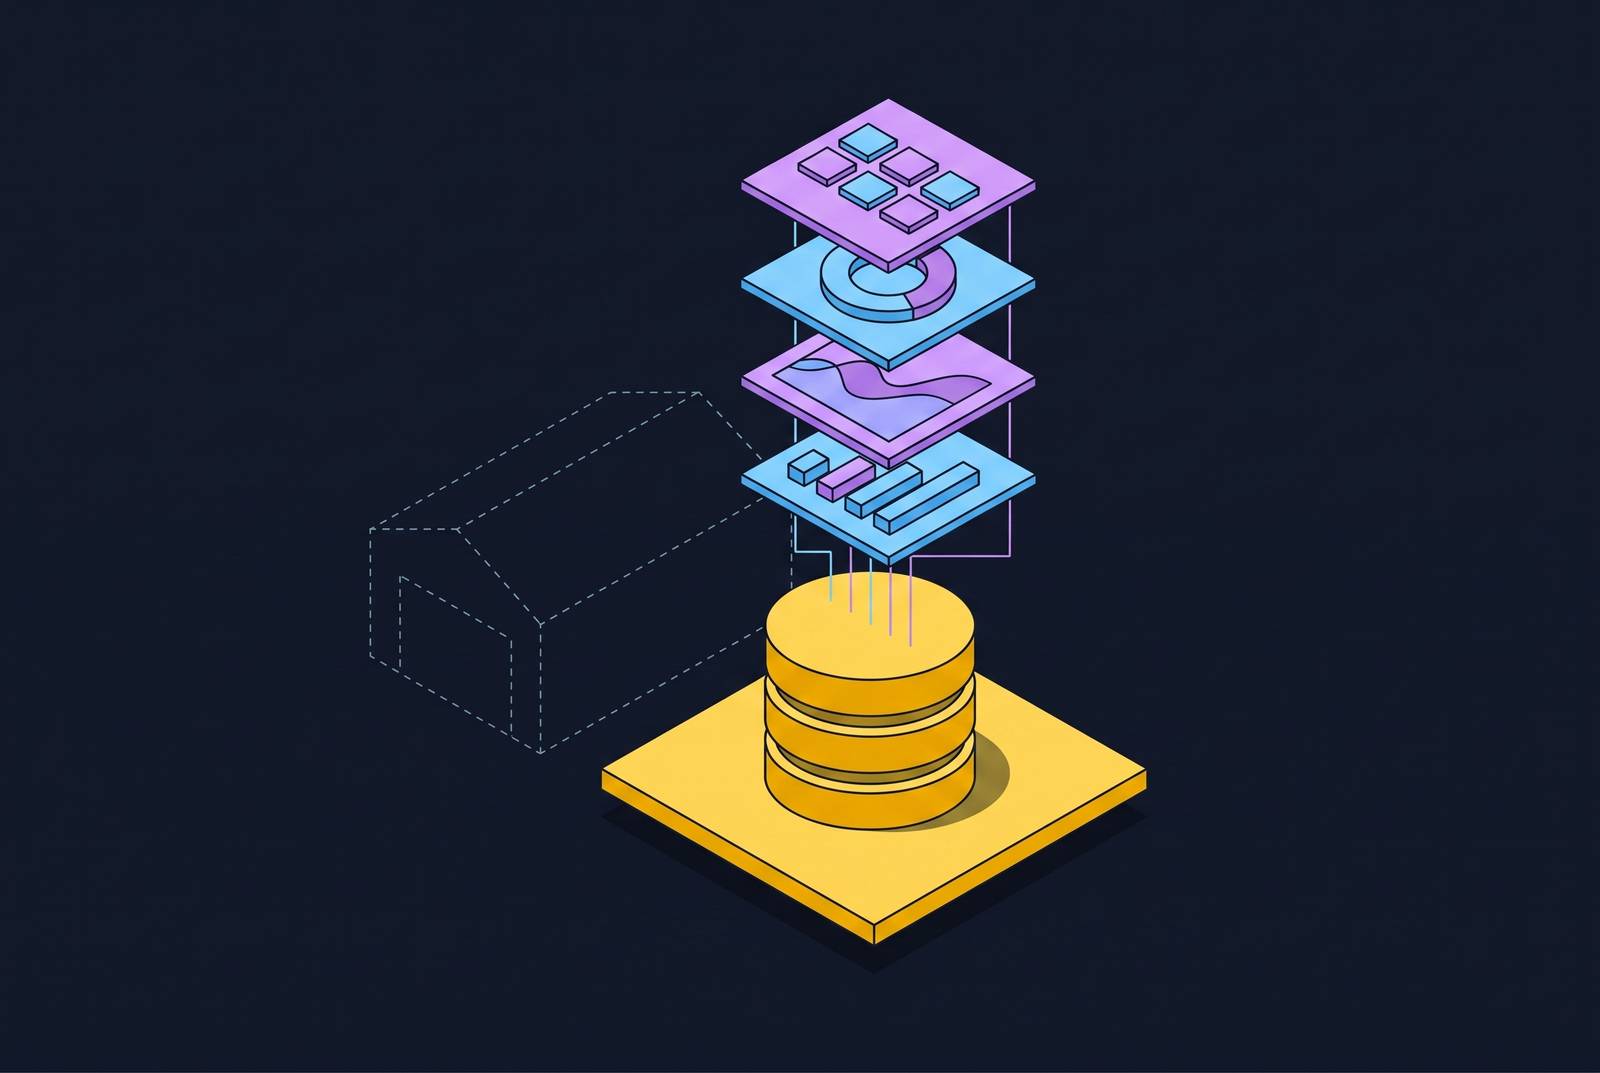
The finished backend has four linked layers. Query routing directs analytical execution to a read replica, optionally using pg_duckdb, while production handles transactions without dashboard queries. Pre-modeled datasets store calculated metrics as governed Parquet files or materialized definitions. A semantic layer enforces shared meanings, and an MCP interface exposes those datasets to agents, BI tools, and applications under controlled access. Operational dashboards run in parallel from Supabase’s Prometheus metrics and feed signals into the same governed layer.
Execution and serving solve different resource problems. Embedded analytical execution accelerates queries, while a governed analytical copy keeps consumer requests away from the production connection pool. Adding MCP server instances cannot, by itself, remove that database bottleneck. When agents query the analytical copy instead, stateless MCP allows the access layer to scale horizontally on its own. The two mechanisms can therefore work together rather than compete as exclusive architectures.
If analytics grows to the point that it needs a warehouse, the metric definitions, semantic model, and MCP interface can stay in place while the store underneath changes. The work that made the numbers trustworthy is not discarded when the infrastructure grows.