Comparing Analytics Vendors That Treat Supabase Postgres as a First-Class BI Source
A vendor test for RLS, query isolation, and agent access.
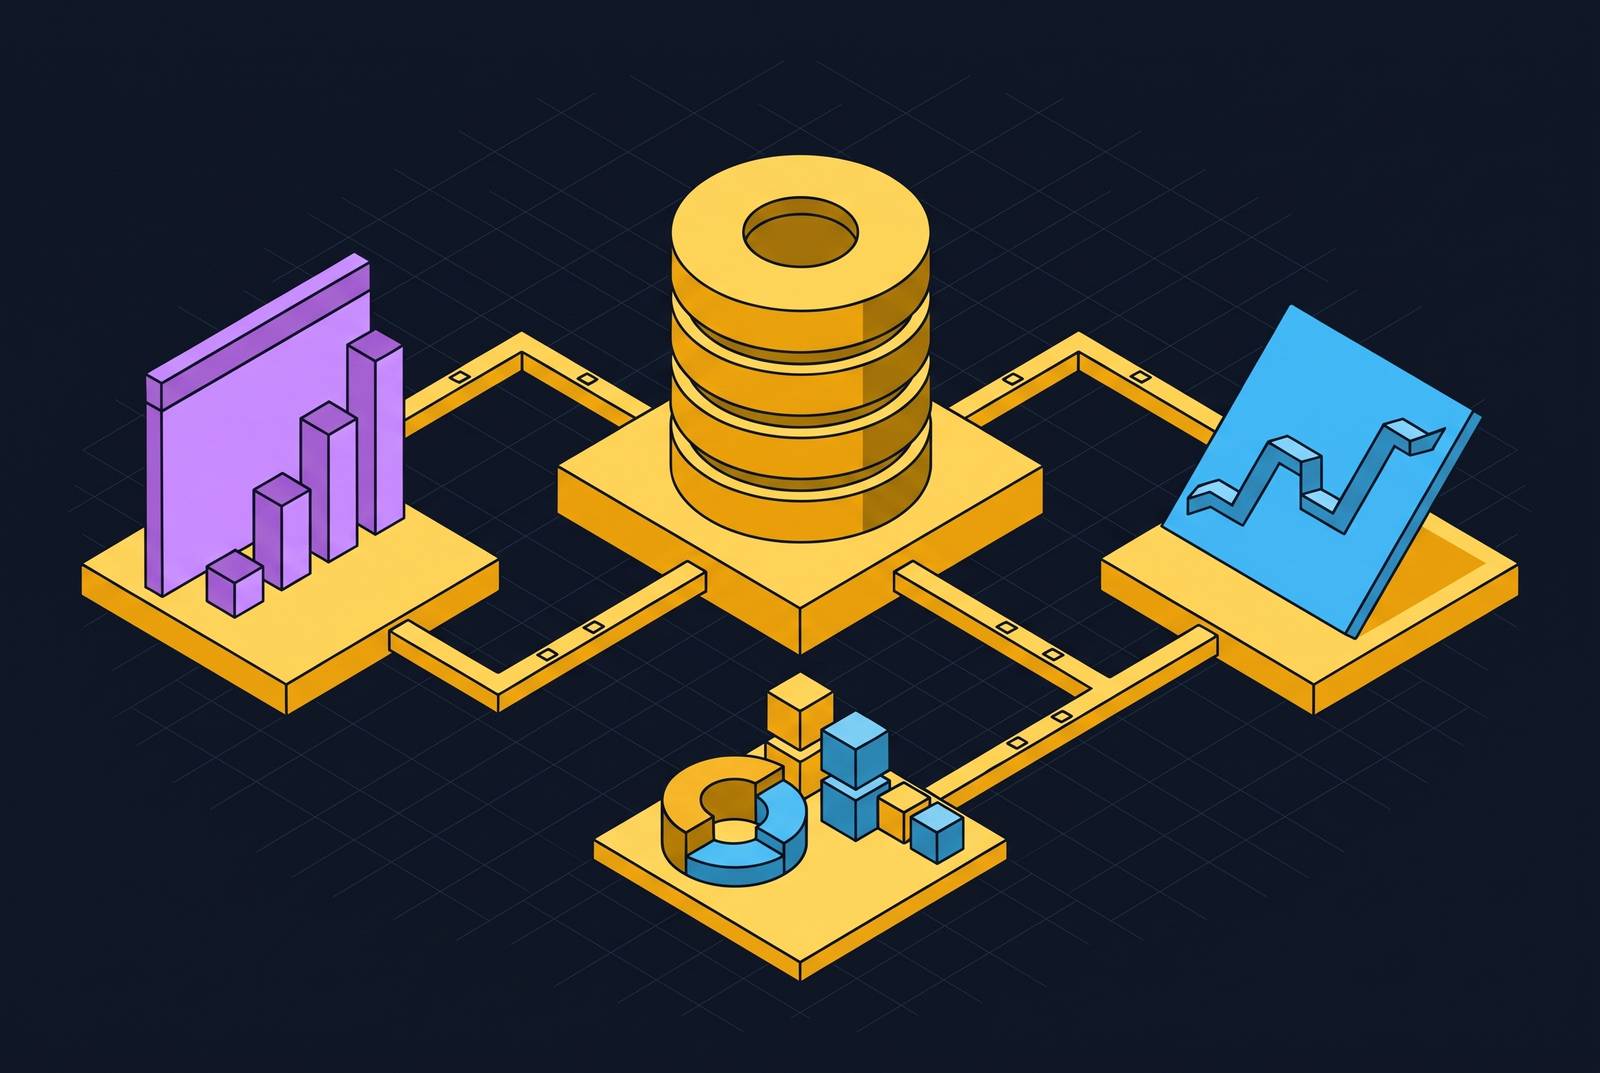
Analytics for Supabase teams should keep Postgres as the analytical home, preserve Row Level Security, and separate dashboard load from transactional work. The best vendor pairs that architecture with metric definitions that everyone shares and governed access for AI agents. A Postgres connector alone proves none of these properties, so the comparison must focus on how each tool queries, secures, and interprets the data.
Why Supabase teams keep hitting an analytics wall
The application works, but a key account wants to see its own data, and the team has no reporting infrastructure to provide it. Supabase supplies Postgres with authentication, storage, edge functions, real-time subscriptions, REST APIs through PostgREST, and GraphQL APIs through pg_graphql. Those services form an application backend.
The workload changes when customers begin opening dashboards. Aggregating large column ranges, calculating historical trends, and serving concurrent dashboard queries are OLAP operations, while row-oriented Postgres is optimized for transactional work. Hardcoded React dashboards become a parallel frontend product to maintain, and exports to legacy BI tools detach reporting from live data and user-context filtering. These workarounds share one flaw when reporting is built around extracted results rather than governed database access. They treat Postgres as an extraction target.
What "treating Postgres as a first-class BI source" actually means in practice
A first-class connection preserves more than table contents. Supabase’s Row Level Security, or RLS, places fine-grained access policies in the database schema, where authenticated identity determines which rows a user can read. A live BI connection that respects those policies inherits the application’s access model. By contrast, a service-role connection that bypasses RLS can retrieve rows regardless of the dashboard user’s permissions. Direct connectivity is therefore necessary for this architecture, but insufficient by itself.
Replication separates the data from that access context. Moving rows into a warehouse or snapshot introduces another place to maintain permissions, handle schema changes, and account for pipeline latency. The copied schema can diverge from the live schema, while the maintenance burden falls on a team that may have no dedicated data engineer. For a ten-person startup, this is also a correctness problem. A dashboard can answer a question about yesterday’s state while the product operates on today’s.
The distinction is between live queries with inherited controls and copies whose context must be reconstructed. It is not a contest over chart counts. A vendor treats Postgres as an analytical home when its reporting path respects the source’s permissions and current state, rather than merely accepting Postgres credentials during setup.
The five architectural tests a Supabase BI vendor should pass
The vendor should explain whether it queries Postgres directly in real time or requires synchronization into an intermediate store. A supported-source logo does not answer that question. Replication introduces freshness and schema-drift concerns that a live connection avoids.
When a dashboard user authenticates, the vendor should establish whether database queries respect that user’s RLS policies or run through a privileged service role. A service-role-only connector leaves customer separation dependent on controls outside the database.
A direct connection can still burden production if dashboard queries compete with transactions for CPU and IO. The vendor should explain whether it uses a read replica, a query-optimized path, or pre-modeled datasets to isolate analytical load. Freshness alone does not make the connection production-ready.
The tool should use table relationships, data types, and what each column means to guide analysis, so every user does not have to write raw SQL against tables they do not know. This also reaches into metric governance. A tool needs more than syntactically valid queries if different authors can assign different meanings to revenue.
The vendor should show whether AI agents can consume governed, pre-modeled data without write privileges or unmediated production database access. A human-only interface leaves that requirement unresolved.
How do BI tools that connect directly to Supabase perform against these tests?
Tableau, Looker, and Power BI connect to Postgres, so a live-query configuration can address the first test. Multi-tenant filtering in these tools requires dashboard-layer work that duplicates database policies to accommodate Supabase’s access model. Querying production also leaves isolation unresolved. Their traditional dashboard configurations do not, by themselves, establish governed agent access, although newer agent-facing offerings require separate consideration.
Commercial and embedding choices add further constraints. Looker can cost several thousand dollars a month, while Tableau Creator licences charge per seat, which can be a poor fit for a ten-person startup. Embedded dashboards can also look like a third-party tool. Scheduled synchronization introduces staleness where it is used. These are distinct considerations from whether the underlying Postgres connection works.
Astrato addresses the live-query and customer-facing embedding requirements directly. It supports Supabase, queries Postgres, and is designed for analytics inside a product rather than exports into a separate reporting environment. Live embedded analytics platforms can address schema awareness and, where they isolate query load, the third test. Implementation still determines the result. RLS inheritance and agent-safe access need demonstration in a trial.
The Supabase partner catalog lists tools built for more specific needs. ParadeDB provides Postgres-native search and analytics, while Buster provides LLM-powered analytics built into products. Both are oriented around Postgres as the primary store. Windsor.ai moves marketing and business data into Supabase, reversing the usual extraction direction. Bemi adds automatic PostgreSQL audit trails at the database layer, which help with governance but do not prove that all the safeguards for safe agent queries are in place.
Softr, Dashibase, and Jet Admin serve a different need. Their scoped business objects and field-level controls suit recurring marketing operations and internal CRUD workflows. Controlled editing is not aggregation or trend analysis. Scoped access for those workflows does not prove Supabase RLS inheritance, and these frontends do not resolve analytical isolation or semantic modeling merely by exposing database rows.
The security consequence is clearest in multi-tenant SaaS. A privileged connection may be tolerable for a single-tenant internal dashboard, but retrieving every customer’s rows makes customer separation depend on subsequent filtering. A missed dashboard filter can expose another tenant’s data, and schema changes create another opportunity for the two access models to diverge. That burden grows with the customer base. Choosing a vendor that inherits RLS means choosing not to rebuild the access model twice.
How the observability gap compounds the analytics gap for scaling Supabase teams
Analytical isolation cannot be judged from a dashboard demo. A query that scans millions of rows can consume CPU and IO needed by the application’s transactional workload. Without historical performance data, a team encountering slow queries lacks a baseline for diagnosis. Business dashboards and database telemetry often sit in different tools, which also makes it harder to connect a drop in activation with increased query time. The analytics decision therefore has operational consequences.
Supabase’s Metrics API works with monitoring systems, so teams can bring database metrics and application signals together in observability tools such as Datadog. CPU, IO, WAL, connections, and slow query logs supplement business KPIs with the operational context needed for the third test. Read replicas, pre-modeled datasets, or query-isolated layers separate analytical reads from transactional writes. Vendor selection should account for that separation and the telemetry needed to assess it, rather than treating observability as a later infrastructure project.
Why AI agents make the vendor choice more consequential, not just more complex
Agents amplify weaknesses that human dashboard use can leave manageable. Bypassed RLS, stale copies, and unaudited queries become more consequential when software queries at machine speed and volume. Read-only enforcement stops writes or deletions made by mistake, while role- and attribute-based access controls limit results to what the requester is allowed to see. Audit trails must record every agent query. Structured interaction transcripts should be collected by the infrastructure, rather than reported by the agent, and governed by the same access controls.
Anthropic released the Model Context Protocol in November 2024. MCP set a standard for connections that had needed custom integrations for each pairing of an agent-framework and a data-source. Connectivity is no longer the only integration problem. An MCP server can expose a governed data layer to compatible agents, but the protocol does not itself establish Supabase RLS inheritance, read-only enforcement, or trustworthy metric definitions.
Tableau’s “Agentic Analytics Platform” includes a cloud-hosted MCP server that exposes governed Tableau knowledge across Claude, ChatGPT, Slack, Teams, and Salesforce. Informatica, now a Salesforce subsidiary, announced fully headless data management with native MCP support at Informatica World 2026 on May 20, 2026. Availability varies by platform, with general availability on Microsoft Foundry and Salesforce, preview on AWS, and private preview on Databricks and Snowflake. These offerings make agent access a concrete vendor-evaluation requirement. Supabase teams still need a modeled, pre-calculated dataset that humans and agents can use safely, and should avoid raw production queries from any process that happens to hold credentials.
The single-source-of-truth requirement that ties vendor choice to business outcomes
ARR should reconcile to billing, cash to the bank, and product usage to the analytics layer. When sales, finance, and product maintain different versions of ARR, executive discussion shifts from decisions to reconciliation. Even simple SQL can introduce disagreement. One engineer’s SUM(revenue) and another’s SUM(amount_captured) can give different Q2 revenue figures even when neither query has an obvious error.
A semantic layer makes the business definition explicit. It defines calculations such as MRR and LTV centrally so that dashboards and AI tools consume the same answer. Updating a calculation once then propagates the definition across those consumers. Keeping that layer at query time avoids a separate ETL copy between the metric and the operational source. It preserves a direct lineage to live tables, although the definition itself still needs governance.
For most B2B SaaS startups, five or fewer actionable KPIs drive decisions. These include MRR/ARR, CAC, LTV or its relationship to CAC, churn rate, and NRR or gross margin. The difficulty is giving every consumer the same pre-calculated value from the same governed definition. A tool that queries Postgres as the analytical home and exposes a semantic layer is therefore not merely convenient, but a mechanism for keeping company numbers trustworthy as the team and its agents scale.
How to run the vendor evaluation: a practical sequence for Supabase founders
The practical sequence begins with the intended consumer. A founder or technical lead should work out whether the team most needs internal dashboards, customer-facing embedded analytics, or metrics that agents can use. These uses impose different access and delivery requirements. Defining the job first prevents a scoped editing frontend from being evaluated as BI, or a human dashboard from being mistaken for a governed agent endpoint.
Next, test the connection and RLS behavior together. Ask how the vendor connects to Supabase. If the answer involves a service role or synchronization, ask what happens to database policies. An unclear answer does not prove that access is live or that permissions carry over. Then measure the vendor’s heaviest dashboard query against production Postgres using CPU and IO telemetry. A spike indicates that the proposed query path has not met the isolation requirement.
Ask whether calculations are centrally managed or recreated by each dashboard author, since independent ARR definitions fail the governance aspect of schema awareness. Then evaluate the agent endpoint. It should give agents governed, read-only data without direct database access and keep a production service role out of their hands. The endpoint’s existence is not enough without those controls.
Most founding teams need a stack that takes an afternoon to configure and one person, typically the technical founder, to own the connection. The recommendation is to favor vendors that demonstrate live access, inherited RLS, isolated analytical work, central metric definitions, and governed agent consumption in the trial.