Wiring Supabase Postgres Directly to a Dashboard Layer Using Only PostgREST and SQL Views
Postgres views and PostgREST can power early dashboards without extra infrastructure.
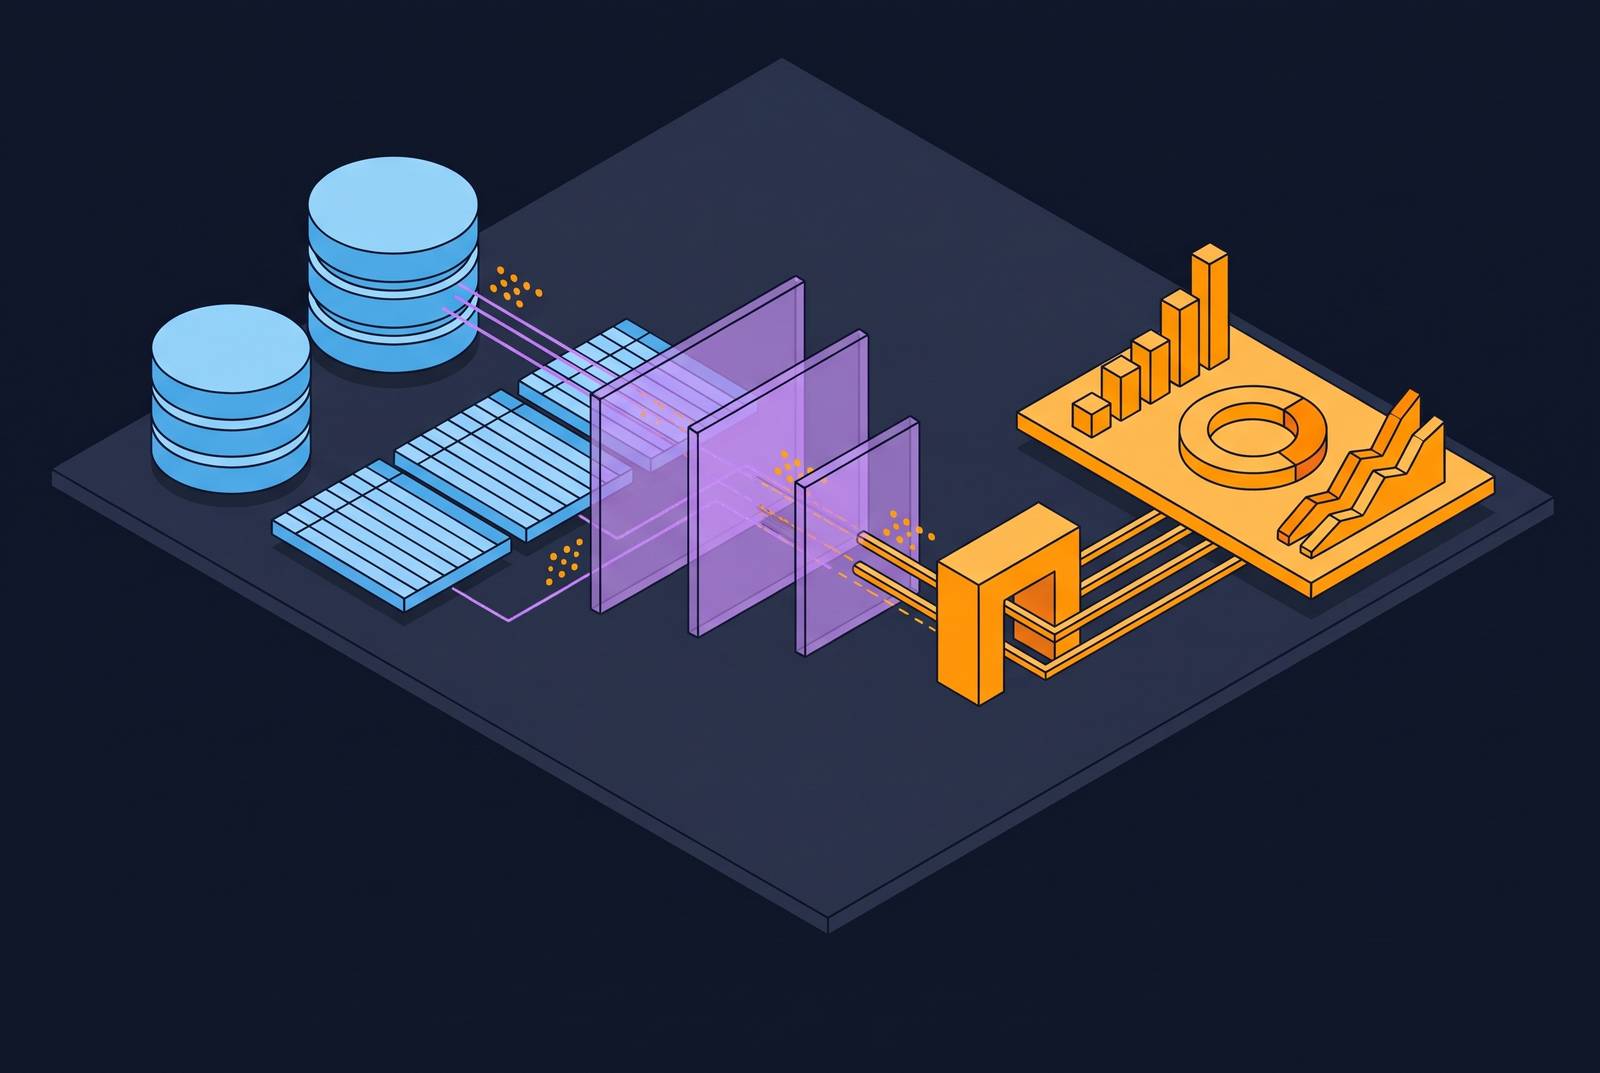
Analytics for Supabase teams can run directly on SQL views exposed through PostgREST, with a dashboard consuming the resulting HTTP endpoints and no additional transformation infrastructure. This approach puts metric definitions, access control, and query serving in Postgres. It works well for early-stage dashboards when freshness, permissions, and query cost are designed explicitly, while larger workloads can extend the same query surface.
How do you get dashboards for your Supabase project using PostgREST views?
A dashboard chart makes an HTTP GET request to a PostgREST endpoint backed by a SQL view. PostgREST reads the Postgres schema on startup and exposes tables, views, and materialized views within its configured permissions as REST endpoints. The chart consumes the response like any other API result. No separate query-serving application sits between the two. Materialized views are read-only through this interface, while regular views have more limited write support than tables.
The view definition supplies the transformation that a separate analytics pipeline would otherwise perform. It can join tables, calculate aggregates, and project the fields the dashboard needs, while Postgres handles permissions and query execution. Unlike a traditional headless analytics arrangement, this pattern needs no separate semantic layer, warehouse, or ETL hop for data already in Postgres. For a small team, that removes the auth, storage, and API plumbing of a separate analytics stack.
Choosing between regular views and materialized views based on what the dashboard actually needs
Freshness requirements and query volume determine the choice between regular and materialized views. A regular view executes its underlying query on every PostgREST request, so the dashboard reads live data. That suits KPIs whose users cannot accept even a few minutes of staleness. Freshness has a recurring execution cost, however. As tables grow, queries that scan them cost more each time the endpoint is called, so what works well for small tables can become painful with more data.
A materialized view stores the precomputed result on disk instead. Daily, weekly, or monthly totals, complex joins, and aggregations over millions of rows are strong candidates because repeated requests can reuse the stored calculation. The difference can be seconds versus milliseconds. That speed comes with a clear freshness contract, because the stored result stays the same until a refresh runs. Minutes, hours, or a day of delay may be acceptable, depending on what the dashboard supports.
A materialized view exposing account_id, metric_date, total_events, unique_users, signups, purchases, and revenue gives charts a shared reporting surface, but unindexed queries can still scan that entire surface. Indexes let Postgres reach the required rows directly. For production refreshes, the recommended default is REFRESH MATERIALIZED VIEW CONCURRENTLY, which allows reads during refresh and requires a unique index. Scheduled refresh through pg_cron or an external scheduler should match the freshness requirement.
Using views as access control — what RLS and column projection actually enforce
Before trusting a dashboard with shared access, the lesson is to verify its database permissions. Column projection leaves PII, internal fields, and anything the consumer does not need out of the view’s output. A WHERE clause can encode business rules, while column aliases expose internal names as business terms. These are structural restrictions on the reporting surface. They are useful only within the effective permission boundary through which the consumer reaches it.
Row Level Security puts the rules for which rows can be read in Postgres, beneath the application routes. When a constrained role has policies that apply to it, even an unfiltered query returns only the rows those policies allow. A dashboard’s customer selector proves none of this. Privileged owner roles and BYPASSRLS roles differ from ordinarily constrained roles, so the actual role and query path require testing.
For read-only analytics, a good starting point is a scoped role with narrow grants on reporting tables or views, with database credentials kept out of consumers’ hands. Tenant context should come from a signed JWT on each request. A shared SQL connection does not automatically supply each viewer’s claims. Testing must therefore cover the configured connection path, the effective role, and the policies that apply to it.
Defining the five metrics that actually belong on a startup dashboard — and encoding them as views
For most B2B SaaS startups, the core dashboard set is CAC, LTV, monthly churn, ARR, and gross margin. Five or fewer actionable KPIs keep the dashboard focused on decisions. Stage still changes the emphasis. Early teams need signs of pull through retention, activation, and user behavior, while later teams need efficiency measures such as payback period, NRR, and margin. The reporting layer should encode the chosen definitions as authoritative.
Without that shared layer, each query defines the metric in its own way. One engineer uses SUM(revenue), another uses SUM(amount_captured), and the resulting Q2 revenue figures diverge. The discrepancy may remain unnoticed until an investor asks for audited numbers. Sales, finance, and product can each have their own version of ARR, too. A chart only shows the result of the definition it gets, so it cannot settle that disagreement.
Giving a view a name and a version makes its metric definition an API contract. Every CEO dashboard metric should reconcile to a single source, and the view name becomes the canonical reference for consumers. Changes then go into the shared definition. The discipline is the same as maintaining an API. A consistently calculated ARR view is more useful than an otherwise perfect calculation repeatedly reconstructed by different people, because its consumers can work from the same answer.
Where the pattern strains — the real limits of PostgREST plus views as a dashboard stack
PostgREST serves queries, but it does not schedule chart refreshes. A chart layer must poll its endpoint or use refresh triggers built for that purpose, or it can show stale data even when the database is up to date. It also provides no push delivery to Slack or email when a threshold is crossed. These are separate delivery requirements. Nor can an ordinary local view natively join data from a second Postgres instance, a third-party API, or an event stream without an additional bridge.
Postgres introduces a different constraint through row-oriented storage. Wide-table scans and large aggregations are less suited to that layout than to a purpose-built columnar store. Materialization cuts down on how often a calculation runs, but the calculation still has a cost. A refresh takes an exclusive lock unless CONCURRENTLY is used, and even concurrent refresh has measurable overhead on very large views. Write-heavy applications also pay the storage and refresh costs of each materialized result they keep current.
SQL definitions do not themselves document intent, ownership, or change history, and renaming or dropping a view breaks the endpoints consumers depend on. A growing collection requires discipline comparable to maintaining a dbt project, without its tooling. A dashboard connected through a service role rather than a user-scoped JWT can bypass RLS, making deliberate permission testing essential even when the SQL is correct.
The escape hatch for columnar workloads — Postgres querying Iceberg via the Foreign Data Wrapper
When heavy scans outgrow row-oriented storage, Supabase provides a bridge to Iceberg tables in an analytics bucket. The Iceberg Foreign Data Wrapper makes those tables queryable from Postgres using standard SQL. Views can sit above foreign tables just as they sit above local tables, so consumers keep using PostgREST as their HTTP surface.
For setup, the recommended route is the Supabase Dashboard UI, although manual SQL installation is also available. On the Analytics Bucket page, the process is to locate the namespace, select “Query with Postgres,” enter the Postgres schema for the foreign tables, and click Connect. Ingestion remains a separate requirement. Replication into Analytics Buckets through Supabase Pipelines is no longer supported, so an external ingestion pipeline must populate the bucket before this query path is useful.
The architectural benefit is continuity at the reporting boundary. The Postgres-facing layer still handles column projection and access control, even though the data is stored elsewhere. The effective role and applicable RLS behavior still require testing through that path. The dashboard need not own that distinction. Its contract remains the view exposed by PostgREST, while the heavier analytical storage workload moves behind it.
Extending the view layer to serve AI agents safely via PostgREST endpoints
An AI agent can consume the same modeled data that serves a chart. Giving it raw database credentials instead permits arbitrary SQL, with risks to data access, production performance, and metric consistency. A modeled, pre-calculated dataset narrows those risks at the interface. A materialized view exposed through PostgREST supplies that dataset without asking the agent to reconstruct the business definition. The database, rather than a prompt, determines what the consumer may retrieve.
For access by agents, the recommended design has a database role just for them with NOBYPASSRLS and FORCE ROW LEVEL SECURITY on every tenant table. Policies read a session variable derived from a verified token. Where a tool entry point runs SQL, it should always open a transaction and set that variable before executing queries. The request context must be explicit and enforced. Through PostgREST, the agent uses a scoped JWT to reach approved views rather than receiving credentials for unrestricted database access.
Those views can join the required tables, remove PII, rename fields, and hide internal schema details. Anthropic introduced Model Context Protocol in late 2024 to standardize how agents interact with external tools and data. The protocol does not replace database permissions. The sensible division remains durable operational data in Postgres, approved read models in views, and agent access through the resulting policy-aware HTTP endpoints.
The minimum viable observability layer that keeps this architecture honest as traffic grows
Once dashboards and agents share the query surface, reliability depends on observing the Postgres instance beneath it. At a minimum, monitoring should cover query execution, connections, and system resources. Each answers a different operational question directly. pg_stat_statements, enabled by default on most managed Postgres, records mean and total execution time, while auto_explain logs plans for queries slower than a configured threshold. Together, they help distinguish a frequently executed query from an individually expensive one.
Connection monitoring compares active connections with max_connections, because exhausted connections cause endpoint failures that may not be apparent from the dashboard alone. Provider dashboards cover CPU, memory, IO, and disk, helping distinguish hardware pressure from query problems. Alerts should lead to a specific investigation. Active connections above eighty percent of max_connections call for examining connection pooling, while growing dead tuple counts on a large table call for per-table autovacuum tuning. A critical endpoint’s p95 latency above its SLO threshold calls for investigating causes such as a new bad query or a missing index on a recently refreshed materialized view.
Quarterly review of the queries with the highest total execution time catches costs that isolated slow-query alerts can miss. A query that runs far more often than expected usually points to a missing cache or a dashboard polling loop, both of which can be seen through pg_stat_statements. This is the operational payoff of collapsing the stack. For the core dashboard path, transformation and query serving are in the database, and the database already provides the instrumentation needed to understand them.