Postgres-First Analytics Tooling Supabase Startups Adopt When SQL Is Already Their Interface
Supabase teams can keep analytics inside Postgres until growth demands dbt.
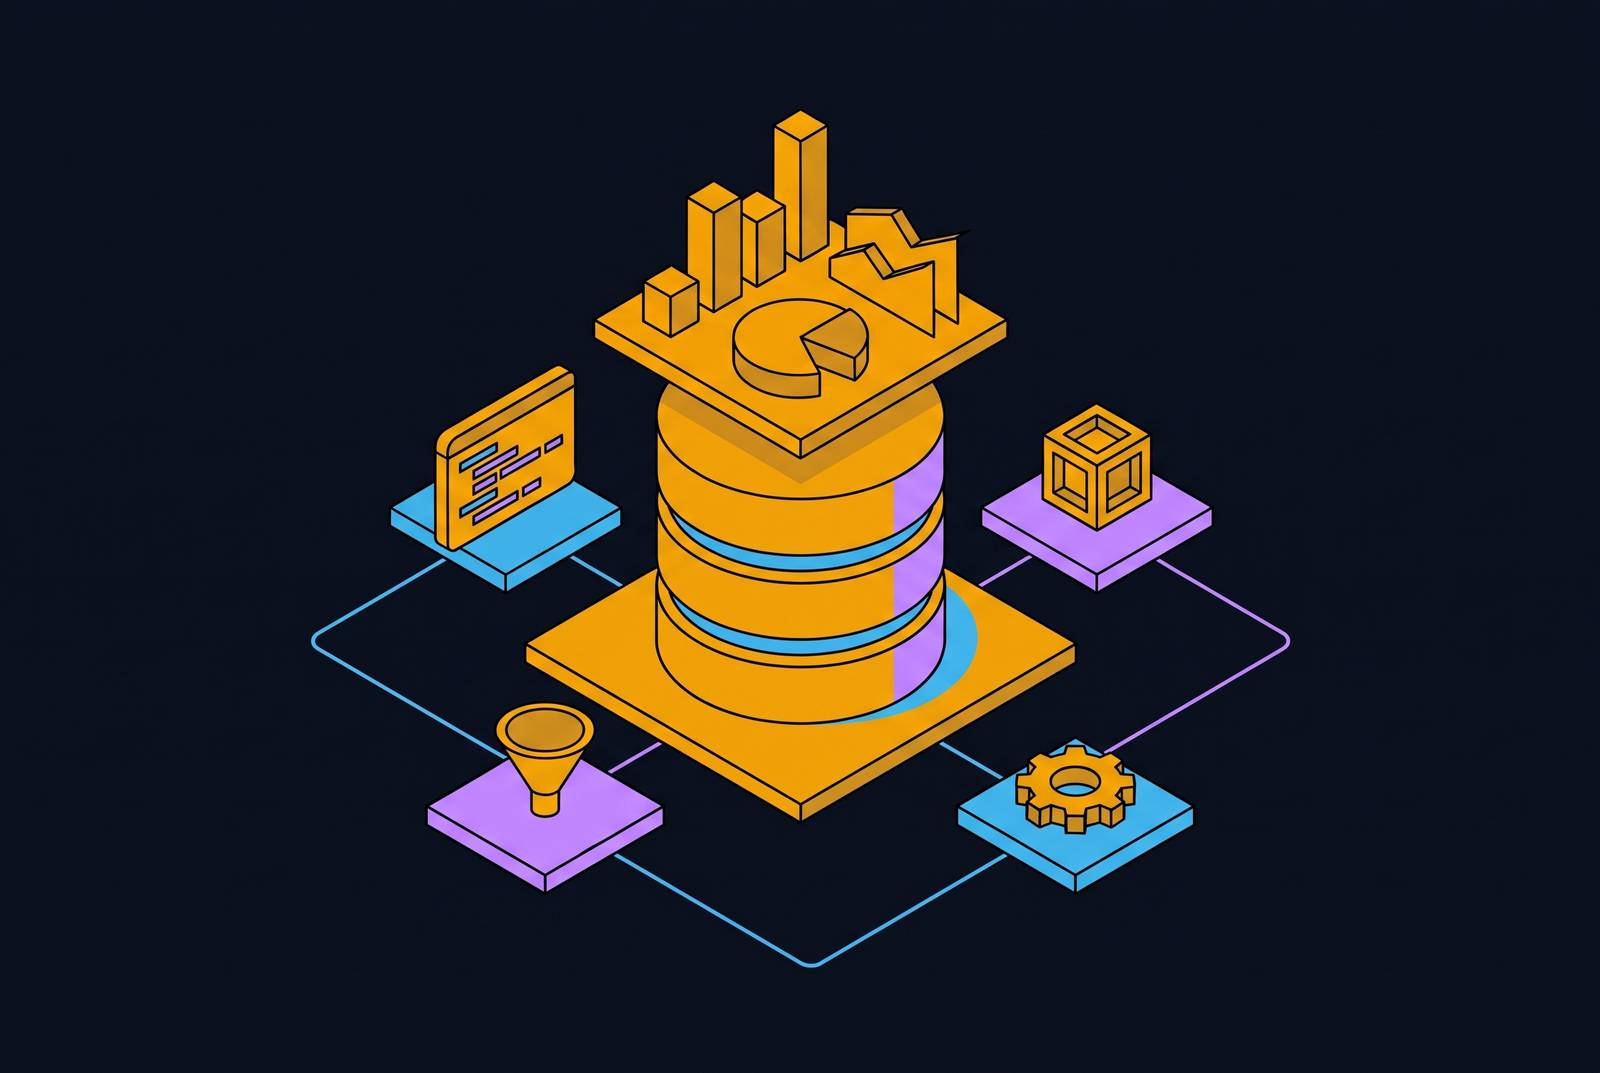
Analytics for Supabase teams works best when tooling extends Postgres. For analytics and dashboards, the key criteria are SQL access, shared metric definitions, policy-aware connections, and predictable database load. SQL clients and product analytics tools serve the MVP stage, while dbt and a governed semantic layer address the consistency problems that emerge as teams grow.
Why Supabase teams are analytically stuck despite having SQL
Supabase teams can write SQL and still struggle to produce dependable analytics. The database already provides views, functions, row-level security, and extensions, but those capabilities do not automatically produce consistent business metrics. The gap is architectural. Teams often choose tools that need data from a warehouse, which forces them to add a costly ETL layer or run analytical queries directly against production Postgres. The first adds a data system to operate, while the second introduces workloads that compete with transactional traffic.
The majority of new databases on Supabase are launched by AI tools, so database creation is outpacing the development of analytical practices. Having SQL available does not settle where metric definitions belong, which credentials analytical consumers should use, or how their queries affect production. These are separate decisions with operational consequences. Tool selection therefore turns on a narrower question than which product is best in the abstract, namely which tools share the team’s SQL-native, Postgres-first model.
What “Postgres as the analytical home” actually means in practice
A Postgres-first tool extends the database’s capabilities rather than requiring its replacement as the center of analytical work. SQL support alone is not enough to qualify. A tool can accept SQL while still requiring a parallel data store, schema changes, or an extraction process before it delivers value. The distinction is whether the team’s existing database logic remains useful and authoritative, or becomes something to reconstruct elsewhere.
That distinction has observable tests. Compatible tools work with views, functions, RLS policies, and extensions. They surface the SQL the team already writes and respect connection limits without placing unpredictable analytical workloads on transactional traffic. These criteria connect usability to operational discipline. A familiar query interface is of limited value if the connection behind it ignores policies or makes production performance harder to control.
Supabase’s architecture already follows this organizing principle. Auth, storage, realtime, and edge functions are built around the Postgres database. That does not require every analytical dataset to remain physically inside Postgres. Supabase introduced Analytics Buckets built on Apache Iceberg to provide queryable analytical storage separate from Postgres for huge datasets. The distinction is between extending the analytical architecture and making extraction into a replacement system the prerequisite for analysis.
A tool that requires data to leave Postgres before any analysis can begin is misaligned with how these teams already work. A tool that preserves their SQL interface and governed definitions can extend the architecture without forcing that break. Does this tool make Postgres more capable, or does it make Postgres unnecessary?
How do Supabase teams get analytics and dashboards at the MVP stage?
At the MVP stage, analytics usually begins with direct inspection of the data already in Postgres. TablePlus, DBeaver, and pgAdmin are the desktop SQL clients many founders use for that work. They make the existing database accessible without requiring a second analytical system. This is a useful starting point. The team can answer operational questions in SQL before it has a need for standardized reporting across many stakeholders.
The choice among clients depends on the database work involved. pgAdmin fits teams that need depth in Postgres features, including extensions, index tuning, graphical query plans, and function debugging. DBeaver supports data export and multiple-environment management, but its edition boundaries deserve attention. DBeaver’s official comparison table reserves Advanced Role Management for the Team edition and excludes the PostgreSQL SQL Debugger from Lite/Community. A client’s name alone does not establish which diagnostic capabilities the team will have.
Product behavior creates a different analytical need. PostHog pairs with Supabase by capturing events, funnels, retention, session replay, feature flags, and experiments. It also has surveys, error tracking, web analytics, and a data warehouse. Those capabilities cover activity that does not fit neatly into SQL tables alone. Its role is therefore complementary, but not an exception to the need for clear ownership of business definitions.
If PostHog and Postgres independently calculate answers to the same business question early on, the team has created two potential sources of truth before it has the capacity to reconcile them. The useful boundary is between collecting and exploring product behavior and maintaining the authoritative calculation of a shared business metric.
ORM decisions influence this foundation earlier than expected. Prisma fits teams working primarily in a typed programming language that prioritize developer ergonomics, but it can create friction when database logic depends on complex views or custom SQL functions. That trade-off extends beyond application development because those same database objects may support analytical work. At this stage, additive tools preserve the value of SQL already written, while tools that obscure it make later standardization harder.
What changes at the growth stage and why dbt becomes the standard answer
The growth-stage shift begins with question complexity. Operational queries give way to CAC payback, cohort retention, expansion revenue, and churn by plan tier. To answer these questions, teams need joins, transformations, and definitions that are the same across the data model. More SQL does not necessarily produce more agreement. Different authors can answer the same question differently because their queries encode different assumptions about the metric.
Series A is the natural inflection point for dedicated ownership. By then, data volume and stakeholder count can justify a data hire responsible for dbt models and the semantic layer. The purpose of that role is to make the business logic behind reports consistent and maintainable. The organizational change follows the analytical one, as shared questions need an owner for their shared definitions.
dbt becomes the standard answer because it gives that ownership a structure. Its ref() pattern and layered models allow a definition to be established once and inherited by downstream reports. Lineage and tests then help the team find and fix what breaks as well as document the model. As more people contribute, they can still see the dependencies without having to rewrite the modeling approach.
A semantic layer extends the same principle to consumers outside the transformation workflow. It defines each metric in one governed place so dashboards, reports, and AI agents use the same calculation. When revenue recognition rules change, the definition can be updated centrally. That is the practical distinction between shared data and shared meaning. Access to the same tables does not guarantee that two tools calculate revenue the same way.
Premature adoption remains a strong objection. An early team may have little data, no orchestration tool, and no metrics layer in which consistency has become a problem. For those teams, dbt adds work to govern data before there is much to gain from that work. The adoption trigger is recurring disagreement or complexity that warrants maintained models, supported by someone who can own them. A funding stage is a useful marker, but the underlying need is operational.
Why AI agents make the single-source-of-truth problem urgent, not optional
A coding agent is the largest contributor of new Supabase databases in 2026, making agent involvement a current architectural concern. Agent access to Postgres needs to be accurate, safe, and compatible with transactional performance. Agents intensify problems that human analytics already exposes. In particular, access to raw tables does not give an agent the definitions needed to reproduce an analyst’s answer.
Giving agents direct access to production also puts performance at risk. Agent query patterns are non-deterministic and can span a wide range of tables, schemas, and row sets. Connection-pool exhaustion is therefore an operational concern. A SQL-capable agent’s workload requires assessment for predictability and suitability for the transactional database independently of its ability to generate a valid query.
Accuracy and authorization require their own controls. An agent querying ambiguously named tables without a semantic layer cannot reliably return the same number as a human analyst. The agent’s answer may give no sign of that disagreement. In Supabase, overprivileged credentials also create a specific RLS risk because a connection can read across the tenant boundaries those policies are intended to enforce. Row-level security protects the analytical interface only when the connection respects it.
The architectural response is to separate analytical traffic at the data layer through pre-modeled, pre-calculated datasets. Agents consume those datasets through a stable interface rather than exploring production Postgres without constraints. That interface is architecturally safer than arbitrary SQL generation, but it does not remove the need for appropriate credentials.
How a governed data layer serves both human and agent consumers from one definition
The useful unit of analytics in an AI-first team is a modeled, pre-calculated dataset. A query is the implementation used to produce or retrieve an answer. The dataset is the maintained analytical product that humans and agents consume. This changes where consistency is enforced. Instead of expecting every consumer to reconstruct the business logic correctly, the architecture gives each consumer the same governed result.
MCP replaces N×M application-to-source connectors with an implementation of a common protocol for each application and each source. A governed data layer can then be reached through a shared interface across tool, dashboard, and agent workflows without duplicating definitions. This reduces connector complexity while leaving the need for modeling unchanged.
That distinction sets the order of construction. An MCP server over raw, ambiguously named tables cannot compensate for an absent semantic layer. The data must be governed before the server exposes it. Pre-modeling establishes the definitions, while the protocol makes them available to consumers.
The CFO’s dashboard, the growth analyst’s dbt model, and the AI agent’s context window resolve to the same number because they draw from the same pre-calculated dataset. None needs an independent version of the metric. This is the logical destination of SQL-native analytics, where the team’s database knowledge becomes maintained definitions. Human and agent access differ in interface, but not in analytical authority.
Observability as the prerequisite that most Supabase teams skip until it costs them
A governed analytical layer still depends on a database whose behavior is visible. Supabase Studio’s built-in metrics support quick health checks, but diagnosing connection spikes, slow queries, and replication lag may require supplemental tooling. Aggregate dashboard tiles are not enough for query-level diagnosis. Without that visibility, a team cannot adequately understand the production effect of the analytical workloads it adds.
This makes observability a day-one concern. Teams that postpone it can discover connection exhaustion and query degradation under real user load, especially after introducing agent-driven queries. Monitoring belongs before analytical expansion because its evidence informs how the data layer should be designed and where workloads need separation.
The sequence is to instrument first, model second, and expose third. Instrumentation establishes operational visibility, modeling establishes shared meaning, and exposure makes governed results available to humans and agents. SQL-native analytics is a discipline of building those layers in order, with observability as its foundation.