SQL Views and Postgres Roles as the Entire Backend for Supabase Internal Dashboards
Scoped roles and invoker-secured views can replace a separate analytics stack.
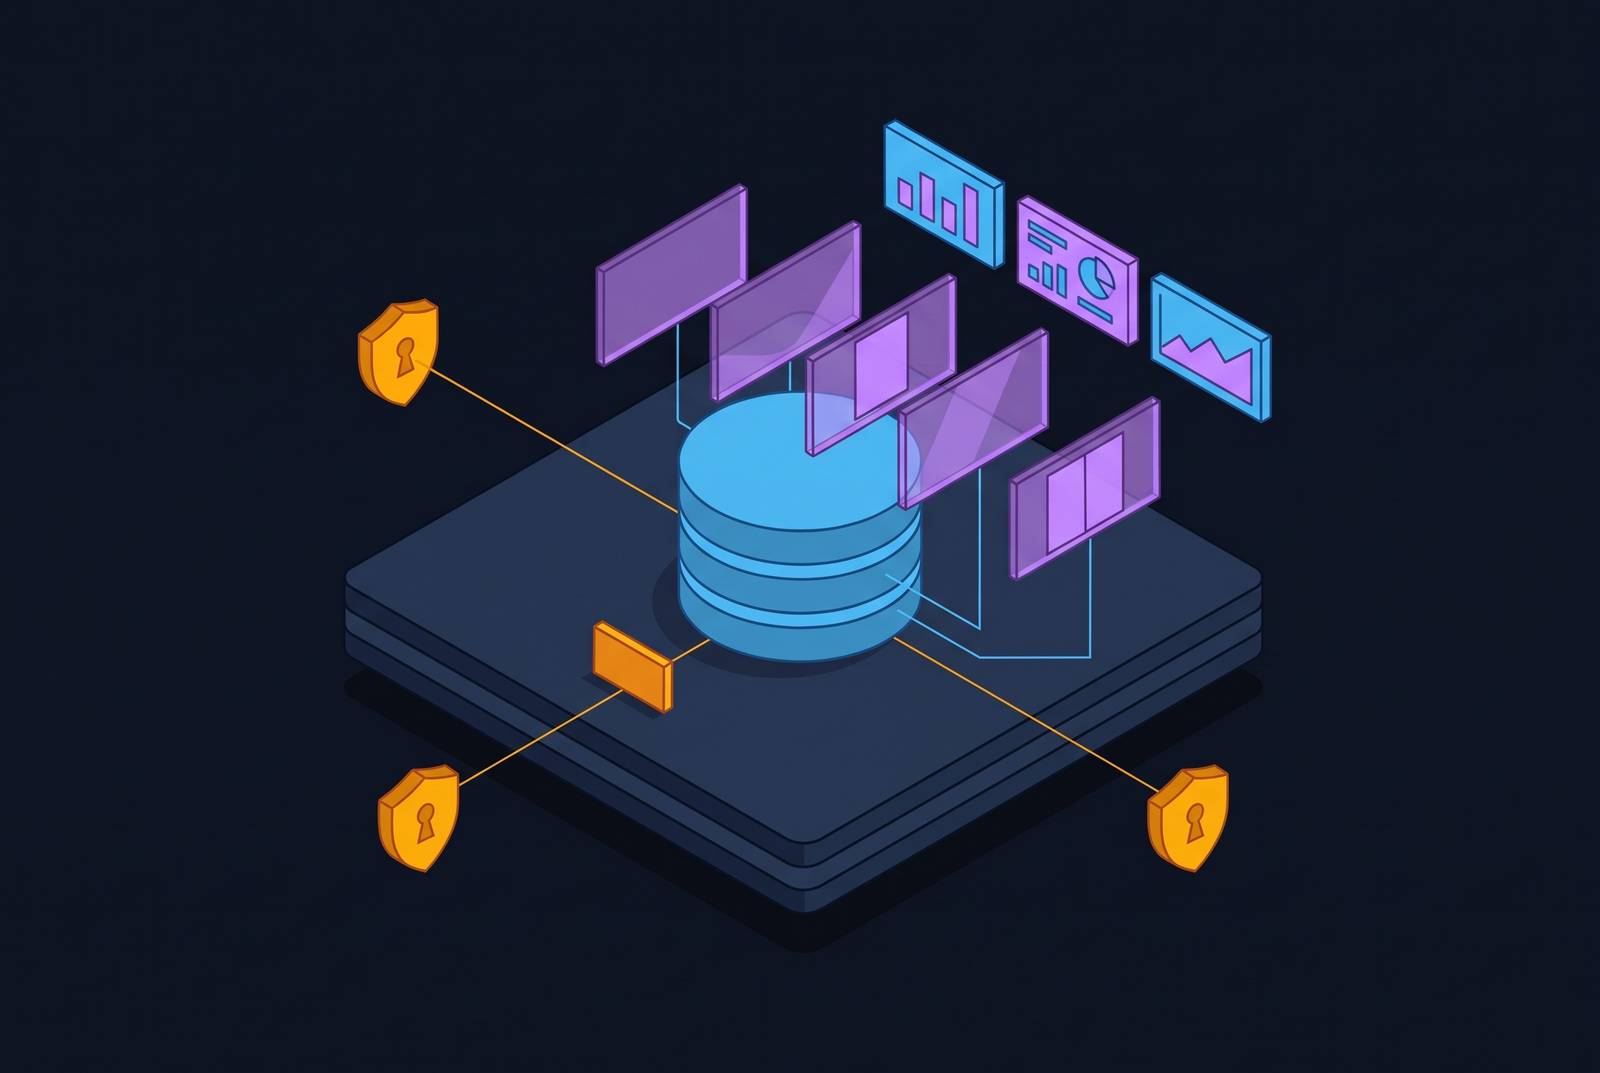
For analytics for Supabase teams, SQL views and scoped Postgres roles can form the entire backend for internal dashboards without ETL, a secondary store, or additional infrastructure. This is a deliberate architecture. Its security and maintainability depend on governed metric definitions, minimal privileges, caller-aware views, and disciplined use of the production database.
Why SQL views and scoped roles form a complete dashboard backend, not just a convenience layer
The application’s ground truth already lives in the database that would serve the dashboard. Each Supabase project runs a dedicated Postgres instance, with SQL, joins, foreign keys, triggers, views, and functions available from the start. The boundary it needs can sit inside Postgres itself.
That boundary separates application storage from analytical access. Views define the results a dashboard can request, while roles define who can request them. Together, they replace infrastructure that early teams would otherwise have to run, but those teams still have to manage access control and metric design. The distinction is between deliberate and accidental access. Ad-hoc queries against production tables are not this architecture, whereas named, versioned views behind narrow roles are.
How Supabase’s role hierarchy maps to dashboard access, and where custom roles fit
Supabase’s role model has four meaningful tiers, namely postgres, authenticator, the application roles, and custom roles created for specific services. The postgres role has broad administrative privileges and is used by Studio and dashboard SQL, with those queries tagged -- source: dashboard in logs. The platform blocks superuser access to prevent destructive actions, leaving the role unsuitable for routine reporting even with that restriction. Sharing its password with a dashboard tool still gives that tool far more authority than it needs.
Below that level of admin access, authenticator is PostgREST’s switching role. The application roles are anon, authenticated, and service_role, but they are not interchangeable choices for dashboard access. In particular, service_role has BYPASSRLS and ignores Row Level Security policies. A dashboard using those credentials can silently expose rows that application users are not allowed to read. A custom role with BYPASSRLS deserves the same treatment as the service key.
The recommended pattern is a fresh database user for each service or tool, with SELECT limited to the views it needs. Schema administration remains separate from daily human and bot access. The postgres password is used only for rare setup tasks.
How do you get dashboards for your Supabase project, and which views should you expose?
Granting SELECT on a whole table exposes all its columns, including raw PII such as emails, phone numbers, and card numbers when those fields are present. A view instead selects the columns needed for the dashboard and gives the result a stable name. Keeping these views in a dedicated schema such as analytics, separate from public, makes that boundary explicit. The intended dashboard surface is limited to that schema’s views.
Metric definitions belong in that surface too. A view named mrr_by_month gives every panel the same calculation, so each engineer does not come up with a different version of SUM(revenue). For early-stage B2B SaaS, the canonical set is MRR, CAC, LTV, monthly churn, and gross margin, with ARR becoming primary at Series A. These metrics can be expressed through views joining billing events, subscription rows, and signup tables already in the application database. When sales, finance, and product use the same definitions, competing ARR calculations stop distracting from business decisions.
Versioning the views makes those definitions part of the code that engineers manage. It also separates the dashboard’s expected output from the joins and calculations used to produce it. However, a stable definition does not make an expensive aggregation cheap to execute. Repeatedly queried aggregations belong in materialized views, refreshed on a schedule. That choice preserves the governed metric while changing when the database does the work.
Why views bypass RLS by default and how security_invoker closes that gap
By default, access to underlying relations is evaluated using the view owner’s privileges. If that owner can bypass RLS, the view can expose rows that the dashboard role would otherwise be unable to read. The query succeeds without a warning or error.
Postgres 15 and later provide security_invoker = true to close this gap. A view created with that option uses the calling role’s privileges, so RLS on the underlying tables applies in the caller’s context. The relevant inline pattern is WITH (security_invoker = true). This is a security property. It makes the caller’s effective permissions part of view design rather than allowing broad owner privileges to stand in for them.
The practical sequence starts with grants, before policy debugging. Default privileges for anon, authenticated, and service_role on tables in exposed schemas should be revoked, then only the access each role needs granted back. A missing grant produces error 42501 before a policy runs, making the failure visible and preserving the access boundary. The invoker setting does not replace that privilege work. The intended view surface and the effective permissions must be tested together.
Security definer functions need the same care because the extra privileges they run with pose a similar risk. The recommended safeguards are search_path = '', schema-qualified names, and placement outside exposed schemas. Testing must use the actual access roles. Running the Security Advisor and pgTAP tests for each role before exposing a view checks the boundary where the dashboard will encounter it, rather than relying on an administrator’s successful query.
Connection budget and workload isolation: keeping dashboard queries from starving application traffic
Correct permissions do not isolate analytical work from application traffic. Connection limits depend on compute size, and smaller instances have substantially fewer direct connections than larger ones. Mobile clients, serverless functions, cron jobs, and dashboards compete for the same budget. Analytical queries can occupy their connections for longer. Multi-join MRR cohorts, churn calculations, and full-table aggregations are read-heavy, but their duration still puts pressure on transactional traffic.
The first mitigation is connection routing. A read-only dashboard role routed through the pooler in session mode avoids creating a fresh backend process for every request. Session mode also preserves prepared statements and is appropriate for analytical dashboard connections. The Supabase database guide describes direct connections, Supavisor as the shared pooler, dedicated PgBouncer pooling, and the choice among direct, transaction, and session modes. Pooling is the first step before the workload warrants a separate replica, while slow queries still require attention.
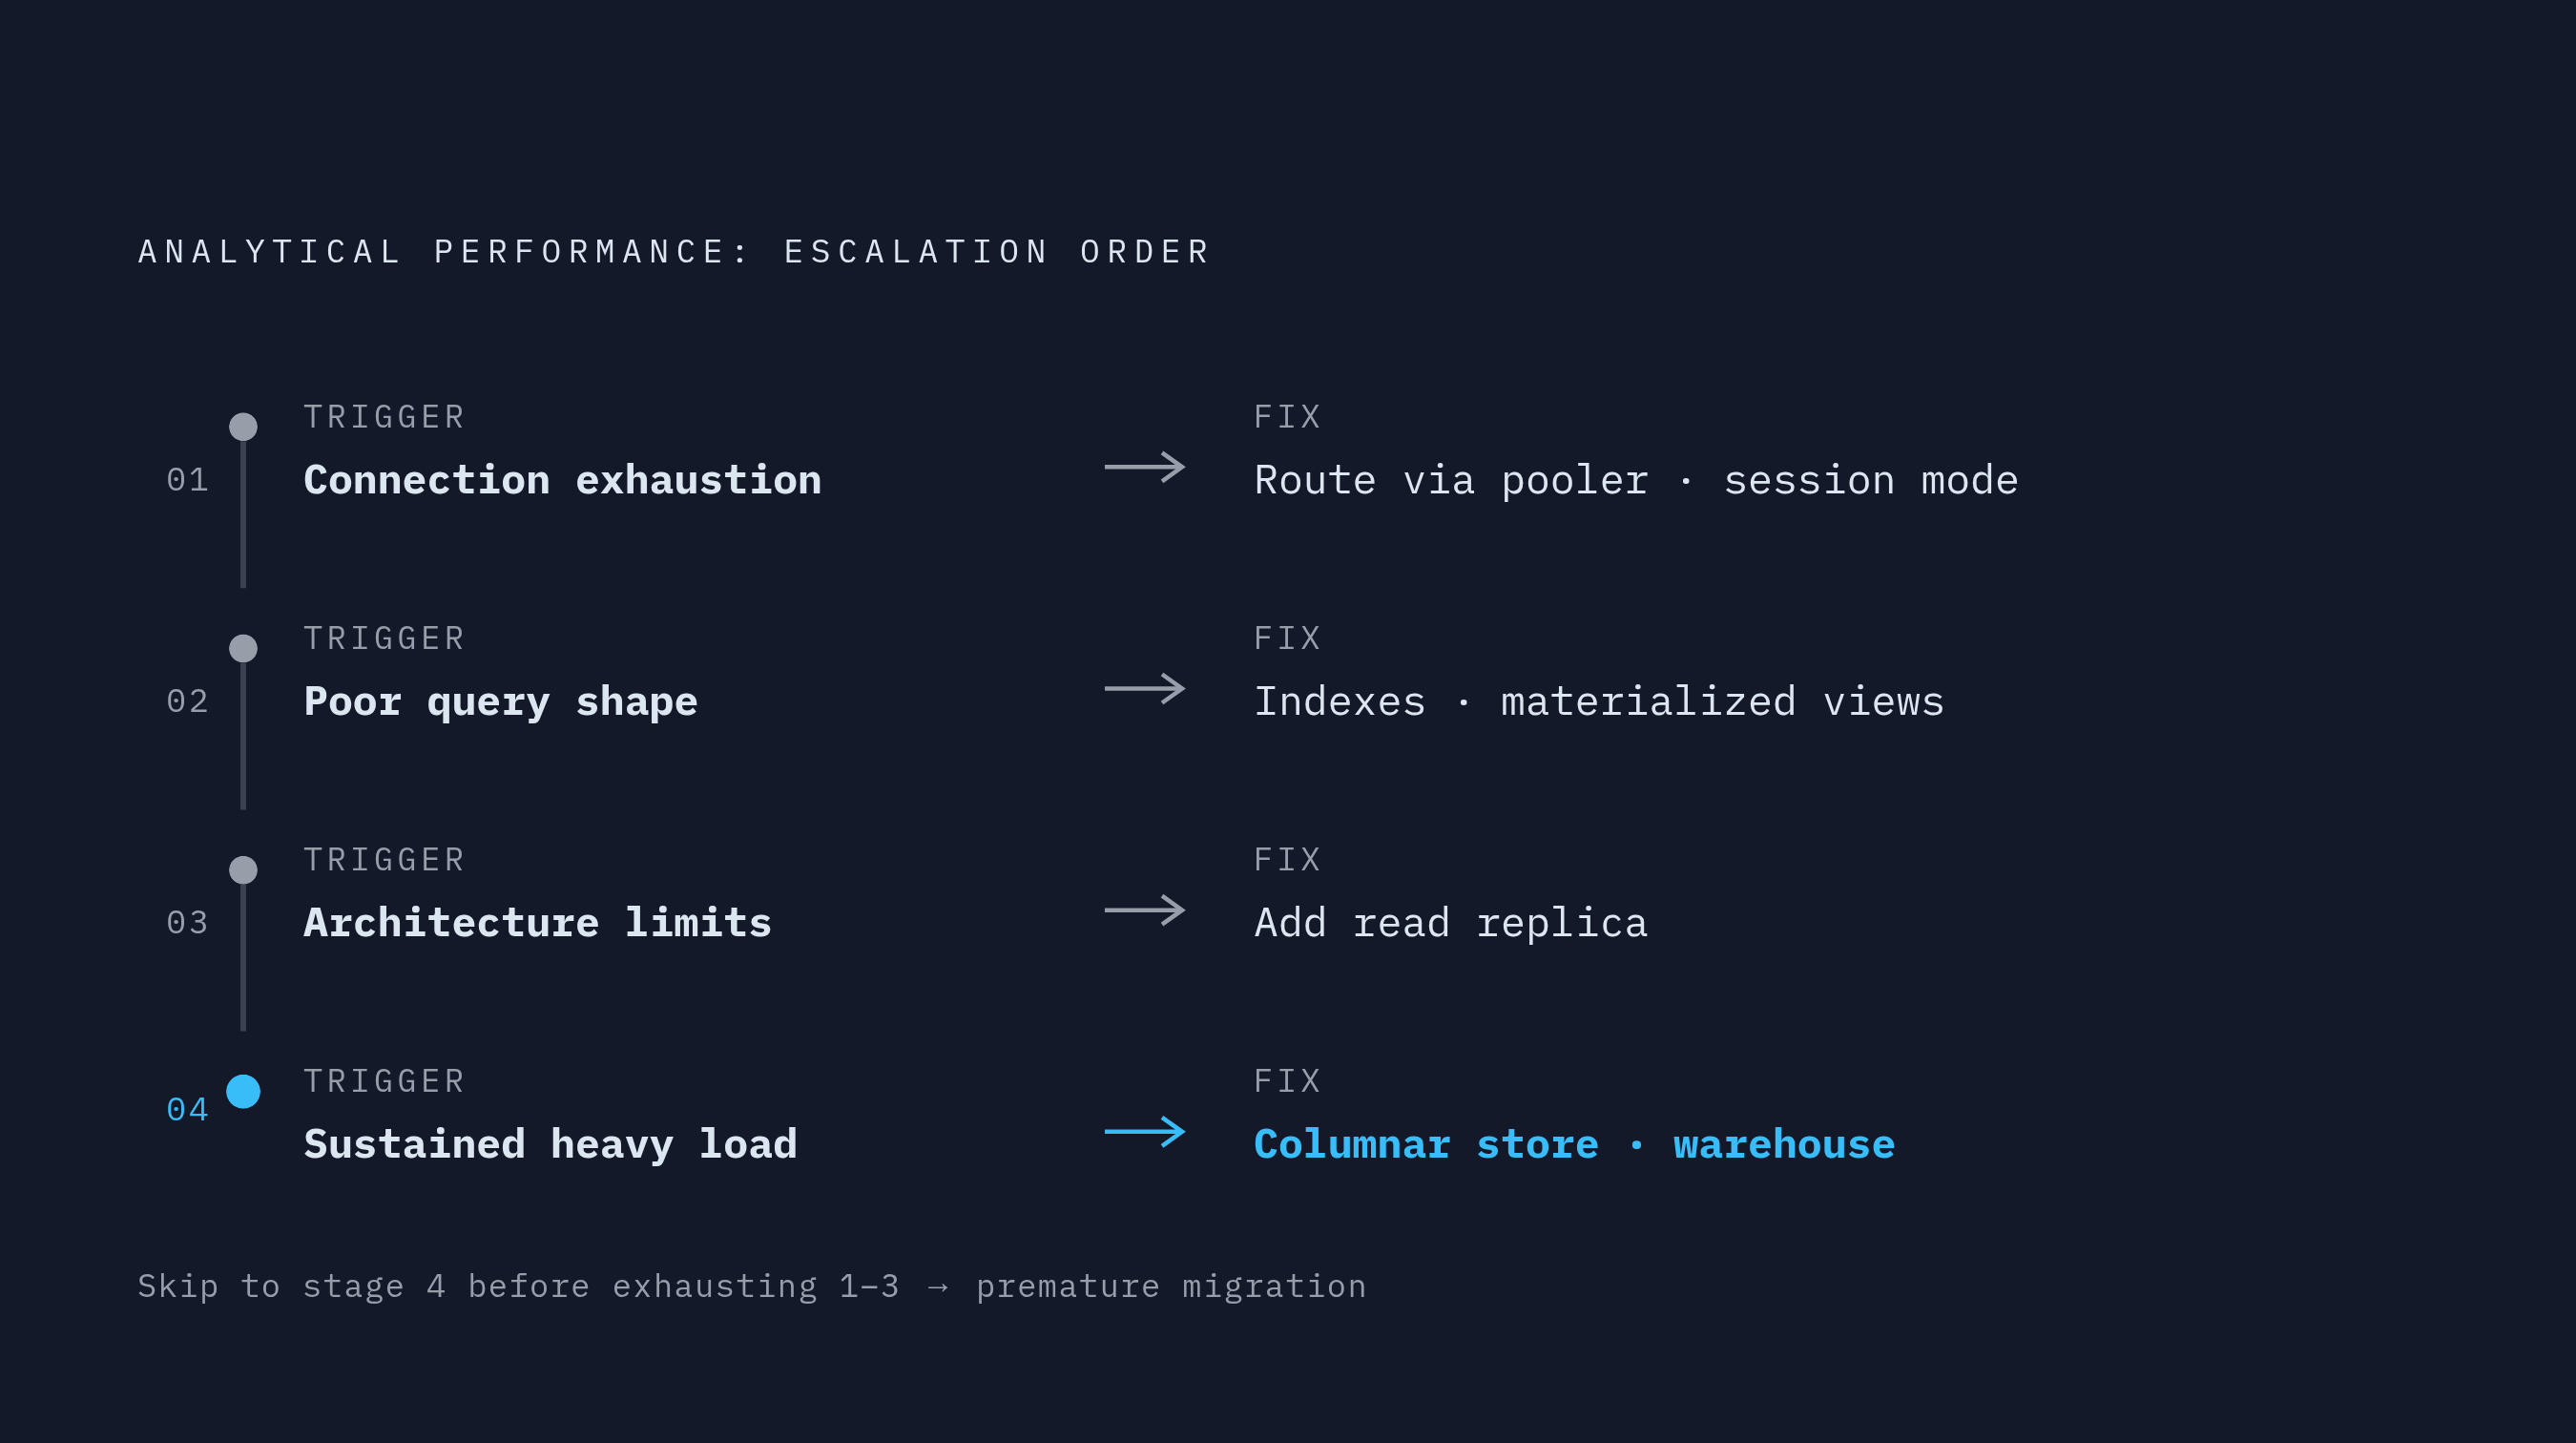
The diagnostic sequence keeps that distinction clear. Common first bottlenecks are connection exhaustion, missing indexes on policy and join columns, noisy Realtime subscriptions, and only then genuine architectural limits. When the connection budget is used up, routing needs to be fixed before the schema is changed. Poor query shape calls for a different response. Treating every slowdown as proof that production Postgres cannot support analytics skips the work needed to identify the actual constraint.
Observability as the precondition that makes this architecture maintainable
Connection routing becomes dependable only when its effects are visible. A view-and-role backend needs dashboards for connection count, query latency, and error rate so that analytical traffic can be assessed against application health. Visibility must precede production reliance on the pattern. Otherwise, the first useful evidence may arrive only after dashboard activity has affected application users.
At a minimum, the alerts need to cover both pressure now and problems that are building up. It includes disk space falling below 20%, active connections exceeding a high fraction of the maximum, and replication lag beyond an acceptable window. Idle-in-transaction connections held open too long also need alerts, as do p95 query latency regressions on critical paths. These signals serve different purposes.
Query-level evidence connects those signals to the view layer. pg_stat_statements surfaces the queries consuming the most total time and those with the highest mean latency, making regular review useful for deciding which materialized views to add. Version-controlled migrations keep a record of what changed. A latency regression can then be traced to a view change. This is what makes SQL a maintainable engineering surface instead of a collection of one-off edits.
Extending the same view-and-role layer to AI agents safely
The boundary built for human dashboards also gives AI agents a governed analytical surface. An agent does not need raw application tables to answer questions about metrics already modeled in views. Reusing those definitions avoids a second, inconsistent interpretation of the business. The access route still needs separate control. Direct database credentials would give the agent whatever authority the connection string permits, with a larger blast radius than a narrowly configured dashboard.
The recommended pattern places a governed API or MCP server between the agent and the database. That intermediary enforces scoped permissions and logs every call, providing the per-user control and query-level audit trail that a direct connection alone does not supply. Named, versioned views with security_invoker = true remain the database-side surface. MCP provides the access mechanism and governs requests while Postgres governs permitted access through roles and RLS.
Pre-modeled metrics also reduce the freedom to construct unintended queries. Their governed output constrains the query shape instead of leaving the agent to assemble calculations from raw tables. This reuses the semantic work already done for dashboards, although the governed access route remains necessary. A further boundary appears if analytical data leaves the primary instance. Production RLS policies do not automatically follow a copy, so the copied dataset must enforce its own access rules.
Where the view-and-role pattern reaches its natural limits and what comes next
The strongest objection to this architecture is workload contention. Aggregations that run for a long time and multi-join cohort calculations compete with transactional work for both connections and buffer cache, even when every permission is correct. Pooling cannot eliminate that competition by itself. Materialized views and read replicas address it for most teams without requiring a separate warehouse, and the database guide covers replication and read replicas as a built-in path. The pattern works cleanly at startup scale and requires more care as workloads grow.
The order of interventions should follow the constraint. Connection exhaustion comes first, query shape comes next, and the limits of the architecture itself come later. Indexes and materialized views address the second stage, while continuously growing tables may also need cold-data archiving. That is a schema and retention problem. Most early teams gain substantial use from the pattern before they need a data team to make a warehouse decision.
Migration becomes necessary when materialized views and a read replica no longer absorb the analytical load. At that stage, the existing view definitions can become the semantic layer feeding a columnar store. One next step is a governed analytical copy of pre-modeled metrics in Parquet datasets, queryable through DuckDB and exposed through a single MCP server. That moves agent requests away from the transactional instance while preserving the established metric definitions and requiring dataset-level access controls.