What Warehouse-Style Analytics Actually Requires and How Supabase Postgres Already Delivers It
Postgres can handle warehouse-style analytics without a separate engine.
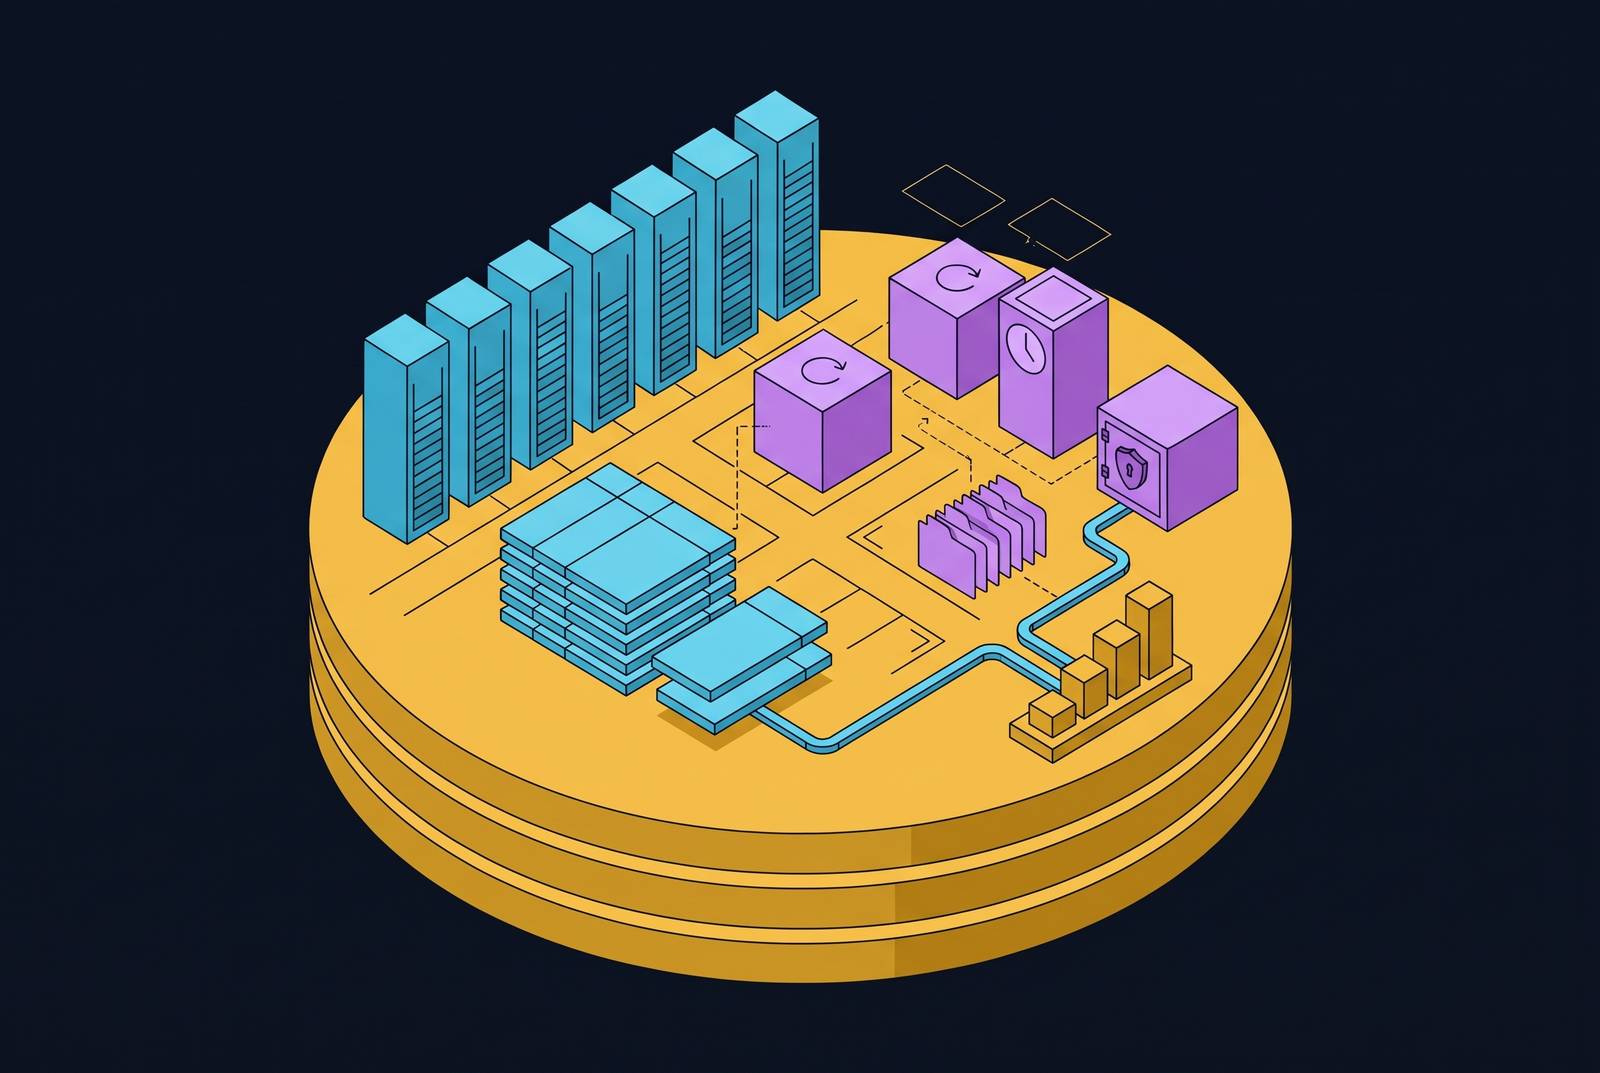
Analytics for Supabase teams does not require a separate warehouse at startup and growth scale. A well-configured Supabase Postgres project can deliver warehouse-style analytics through reduced page reads, pre-aggregation, isolated reporting queries, and governed access. Getting analytics and dashboards for a Supabase project is therefore first a question of configuration and shared metric definitions, with a separate analytical engine becoming justified when observable operational limits appear.
What warehouse-style analytics actually requires
An analytical query scans millions of rows to return dozens. It reads a few columns from a wide table, aggregates values, and applies window functions. Data arrives in batches, concurrency stays low, and acceptable latency is measured in seconds. Transactional workloads ask for almost the reverse.
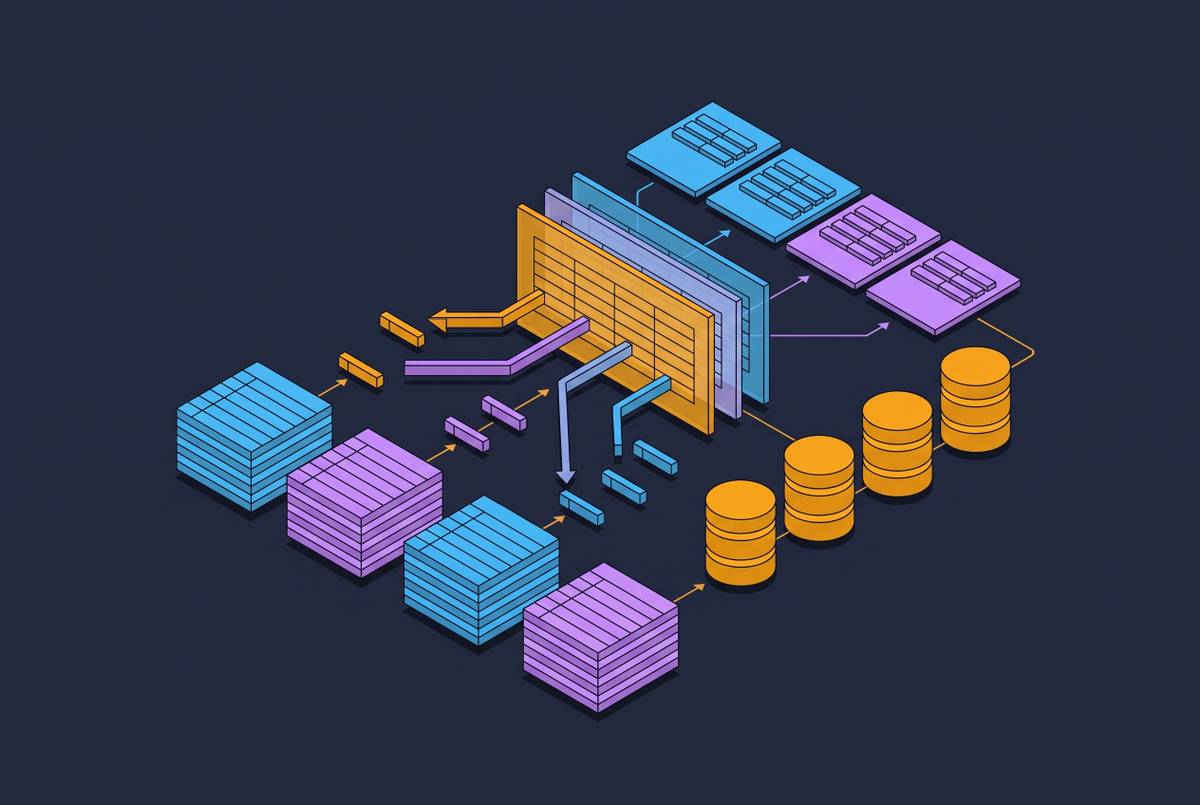
That difference creates a storage problem for Postgres. As a row store, it reads whole rows from disk even when a query needs only a few columns. Columnar storage avoids much of that unnecessary reading. To work as substitutes, other approaches must cut the number of pages read.
The workload therefore imposes five requirements, namely columnar-friendly reads or effective page-reduction substitutes, pre-aggregation, isolation from production traffic, governed access, and scan-oriented tuning. Pre-aggregation prevents repeated scans of raw facts, while isolation protects application writes. Governance restricts which roles can query which data. Tuning then allocates resources for broad, low-concurrency scans rather than many small, latency-sensitive requests.
Why most early-stage teams are nowhere near Postgres's analytical ceiling
Postgres has a real analytical limit, but startup reporting workloads often sit well inside it. Adding a separate engine at that stage introduces another system before the existing one has been configured for reporting. Operational simplicity has concrete value when the analytical workload does not yet demand specialization.
Xata built its product analytics warehouse on vanilla Postgres, bringing together identity from Keycloak, product usage from its metastore, billing from Orb, and behavioral events from PostHog. Its choice favored stack integration and operational simplicity over marginal gains from an OLAP engine. Xata stated the reasoning directly. “Instead of optimizing for scale we don't yet have, we chose to move fast, learn, and build with the tools we already know”.
That example establishes a useful starting point. Capacity depends on pipeline design as well as data volume. A row count alone cannot tell a team which architecture to use. The more useful boundary is observable stress that remains after the database has been configured for its analytical workload.
How time-based partitioning and BRIN indexes substitute for columnar reads
Time-based partitioning reduces reads before an index enters the picture. Declarative range partitioning on a timestamp column lets Postgres eliminate monthly or daily partitions outside a query’s time window. Constant filters allow pruning at plan time, while parameters allow it at execution time. Both BI-generated SQL and prepared statements can benefit. The storage is still row-oriented, but the scan reads fewer pages.
Partitioning also changes how retention works in practice. Detaching and dropping an old partition avoids the per-row WAL records and bloat produced by a large DELETE. The operational recommendation is to keep partition counts in the hundreds. With too many partitions, planning can take longer than execution, so the time saved on scans can be lost to planning.
Within the remaining partitions, BRIN indexes provide another filter. Append-only events often arrive in timestamp order, so a BRIN index can keep the minimum and maximum values for ranges of pages without having to maintain a full B-tree. On a 500-million-row events table, that index can occupy only megabytes. Its usefulness depends on physical order. A pg_stats correlation above roughly 0.9 shows that the data is in a useful order, but with lower correlation, the scan may still read nearly every block. Out-of-order arrivals can be corrected with CLUSTER during a maintenance window.
How materialized views pre-aggregate answers so dashboards never scan raw tables
Materialized views remove repeated work from the dashboard request path. If a dashboard repeatedly asks five questions, those answers can be computed at refresh time and reused on every load. The basic pattern uses CREATE MATERIALIZED VIEW, a GROUP BY over date_trunc and event dimensions, and a unique index on the grouping columns. A pg_cron schedule keeps the result fresh according to reporting needs. Xata uses scheduled refreshes for this purpose.
The unique index enables REFRESH MATERIALIZED VIEW CONCURRENTLY. Dashboards can continue reading during the refresh. Concurrent refresh costs more than plain refresh because it computes the new result and compares it with the old one. That trade-off favors views serving live dashboards, where read availability is part of the requirement.
For incremental rollup tables, a watermark provides a different refresh pattern. New rows since a MAX(day) watermark are inserted, with conflicts resolved through ON CONFLICT DO UPDATE. This makes refresh work proportional to new data. It is distinct from refreshing a materialized view. Both approaches do the costly aggregation before an interactive request needs the result.
The SQL defining “daily active users” or “revenue” becomes shared infrastructure. When both analysts use the same defined rollup, one cannot quietly swap SUM(amount_captured) for SUM(revenue). The shared model prevents that particular source of drift.
How a read replica and role-level tuning isolate analytics from production traffic
Supabase provides read replicas for read-heavy workflows, allowing analytical queries to run away from the application's write path. Connection pooling reuses connections between queries without requiring teams to build that infrastructure. Replication lag, WAL growth, and slow query logs show whether reporting still works well as demand grows.
A dedicated analytics role separates reporting settings from transactional defaults. Setting work_mem to 256MB can keep larger sorts in memory and permits hash aggregates up to 512MB with the default hash_mem_multiplier of 2.0. Each sort or hash node, in each worker, can consume its own allocation, so a global increase can multiply memory demand dangerously. Applying it to a low-concurrency reporting role confines that risk to the intended workload.
Other role-level controls include max_parallel_workers_per_gather, effective_io_concurrency, and JIT. A reporting-role statement_timeout limits the time runaway BI queries can hold locks. The effect is visible through EXPLAIN (ANALYZE, BUFFERS). An external merge sort using 412MB of disk indicates a spill, while a quicksort using 84MB of memory does not.
Supabase has tools to help teams look into those differences. Performance advisors provide deterministic checks, Index Advisor appears in the dashboard, and pg_stat_statements is available as a standard extension. Together, they help teams see whether they need to change a query or add more capacity for analytics.
How do you get analytics and dashboards for your Supabase project?
These database techniques support reporting, and Supabase shows how it is running. Its Logs and Analytics feature, powered by Logflare, tracks events across the API gateway, Postgres databases, Storage, and Edge Functions. A multi-node, highly available Elixir cluster ingests those events. That unified view connects query behavior with the surrounding application stack rather than treating the database as an isolated component.
The Metrics API exposes performance and health metrics in Prometheus exposition format. A single scrape job covers CPU and memory use, active connections, pool saturation, query latency, slow queries, replication lag, WAL growth, and storage use. This makes analytical health observable beyond dashboard response time. A fast result is insufficient if the replica serving it has fallen behind.
Supabase's one-click Grafana Cloud integration, launched in July 2026, connects every project, including free-plan projects, to a pre-built dashboard with metrics and alerting. That removes the need to assemble an observability stack simply to monitor the database. Log drains support alerting pipelines, while pg_partman is available for partition management. These capabilities complement business dashboards. For analytics infrastructure, their value is making lag and operational degradation visible before reporting becomes unreliable.
Where the ceiling actually sits and what changes when you hit it
Postgres's practical analytical boundary becomes apparent through operational symptoms. Autovacuum may fail to keep up after nightly loads, while dashboard queries wait on ETL locks. Incremental models may still perform full sequential scans because watermark or join keys lack indexes. Repeated recommendations for a bigger instance can signal unresolved pressure. These are diagnostic signals that call for investigation before concluding that Postgres has been exhausted.
A DELETE-and-reload pattern can produce unbounded bloat, and transforms sharing a primary with BI can create avoidable lock contention. Small datasets can suffer from those choices. Larger datasets can remain manageable when partitioning, incremental processing, and isolation address the underlying work.
When those techniques no longer suffice, the upgrade can be additive. The managed Postgres landscape in 2026 includes columnar acceleration through AlloyDB, distributed sharding through Citus and Azure Database for PostgreSQL Elastic Clusters, and time-series specialization through TimescaleDB via Tiger Cloud. Another approach pairs transactional Postgres with a separate columnar engine through CDC, with replication latency measured in seconds. Postgres remains the system of record.
An in-process option changes execution rather than that role. pg_duckdb embeds DuckDB’s vectorized engine inside Postgres, including for analytical queries over Parquet files in object storage. It works with workloads where there is still little hot data but the cold analytical history has grown into object storage. The query interface stays the same while heavy analytical work moves to a different engine.
When agents have access, the isolation boundary is also a security boundary. A live demonstration showed Cursor using a Supabase database with elevated service_role access while it read messages sent by customers. A crafted message could induce unintended SQL. The failure joined untrusted input directly to privileged database operations, rather than merely producing an inaccurate analytical answer.
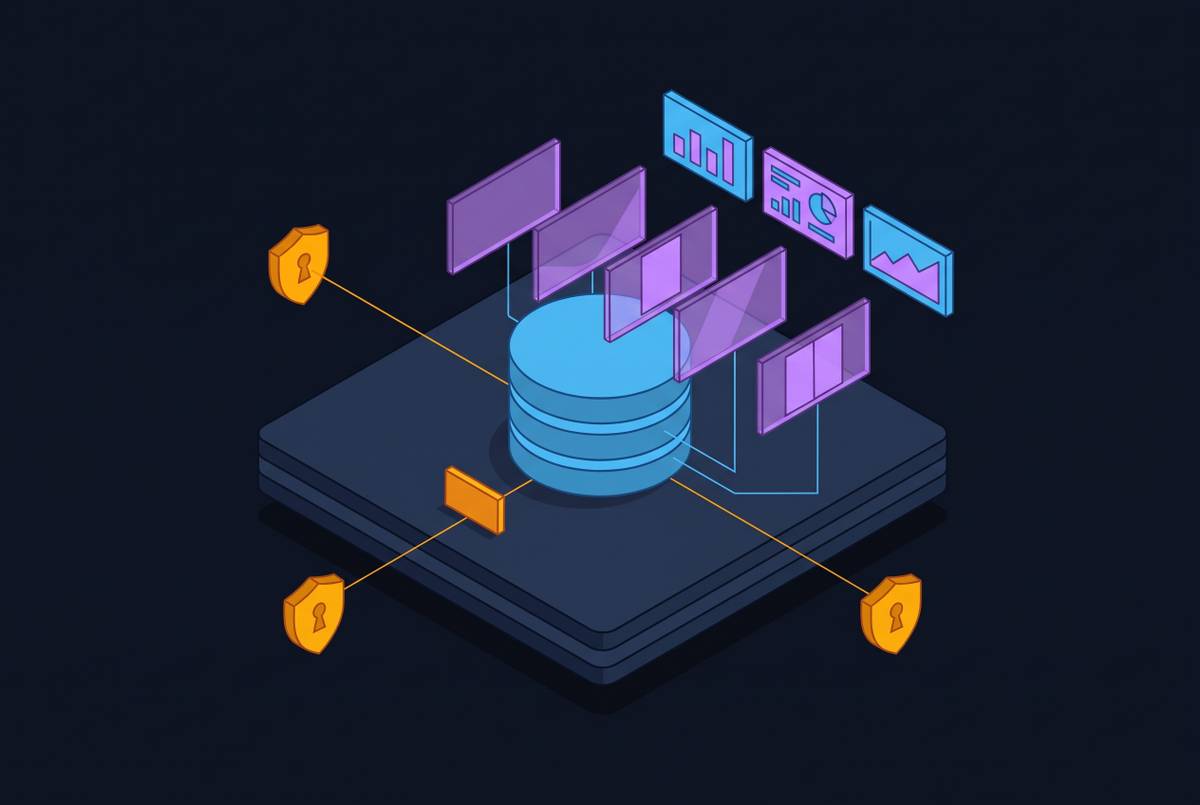
Supabase's guidance says that the service role key bypasses all Row Level Security policies and gives full access to data exposed through the API. It belongs exclusively in administrative tasks and schema migrations. With RLS, the database enforces row filtering. Supabase also advises against connecting AI agents directly to production data, positioning MCP for development, staging, branched databases, or obfuscated and anonymized datasets.
The corresponding governance standard is Zero Standing Privilege. Agent credentials should be short-lived and task-scoped. Every interaction should be recorded automatically in structured transcripts through out-of-band metadata channels. Provenance must not depend on what the agent reports about itself. These controls extend the same role separation and isolation that protect production from analytical workloads.
How a governed data layer serves both human dashboards and agents from the same pre-modeled datasets
A governed dataset extends the materialized-view pattern beyond the database. Instead of asking each consumer to reconstruct an answer from raw tables, the architecture provides pre-modeled, pre-calculated data with shared definitions. Humans and agents then use the same data for analytics.
For Supabase teams, one such pattern uses governed Parquet datasets queried through DuckDB and exposed to agents through an MCP server. The pre-calculated rollup becomes portable rather than remaining bound to a live production query. DuckDB runs the analytical queries at near-zero cost per query, and MCP provides a standard interface for access. Agents get the data they need for analysis without touching the production database.
The access layer also separates model choice from data governance. Different agents use the same approved definitions instead of each writing its own SQL against raw operational tables. Human dashboards can consume those same pre-modeled datasets. An “active user” or “monthly revenue” definition is encoded once, so consumers do not create competing versions merely by choosing different source columns.
Postgres remains the transactional record, scheduled models establish the analytical definitions, and isolated, governed interfaces serve the results. A separate warehouse becomes a response to demonstrated execution needs. The durable investment is the shared data model and its access boundary, whether the next consumer is a dashboard or an agent.