Replacing Your Analytics SDK With Direct Postgres Event Queries in Supabase
Querying Postgres directly keeps metrics consistent, until load and scale demand more.
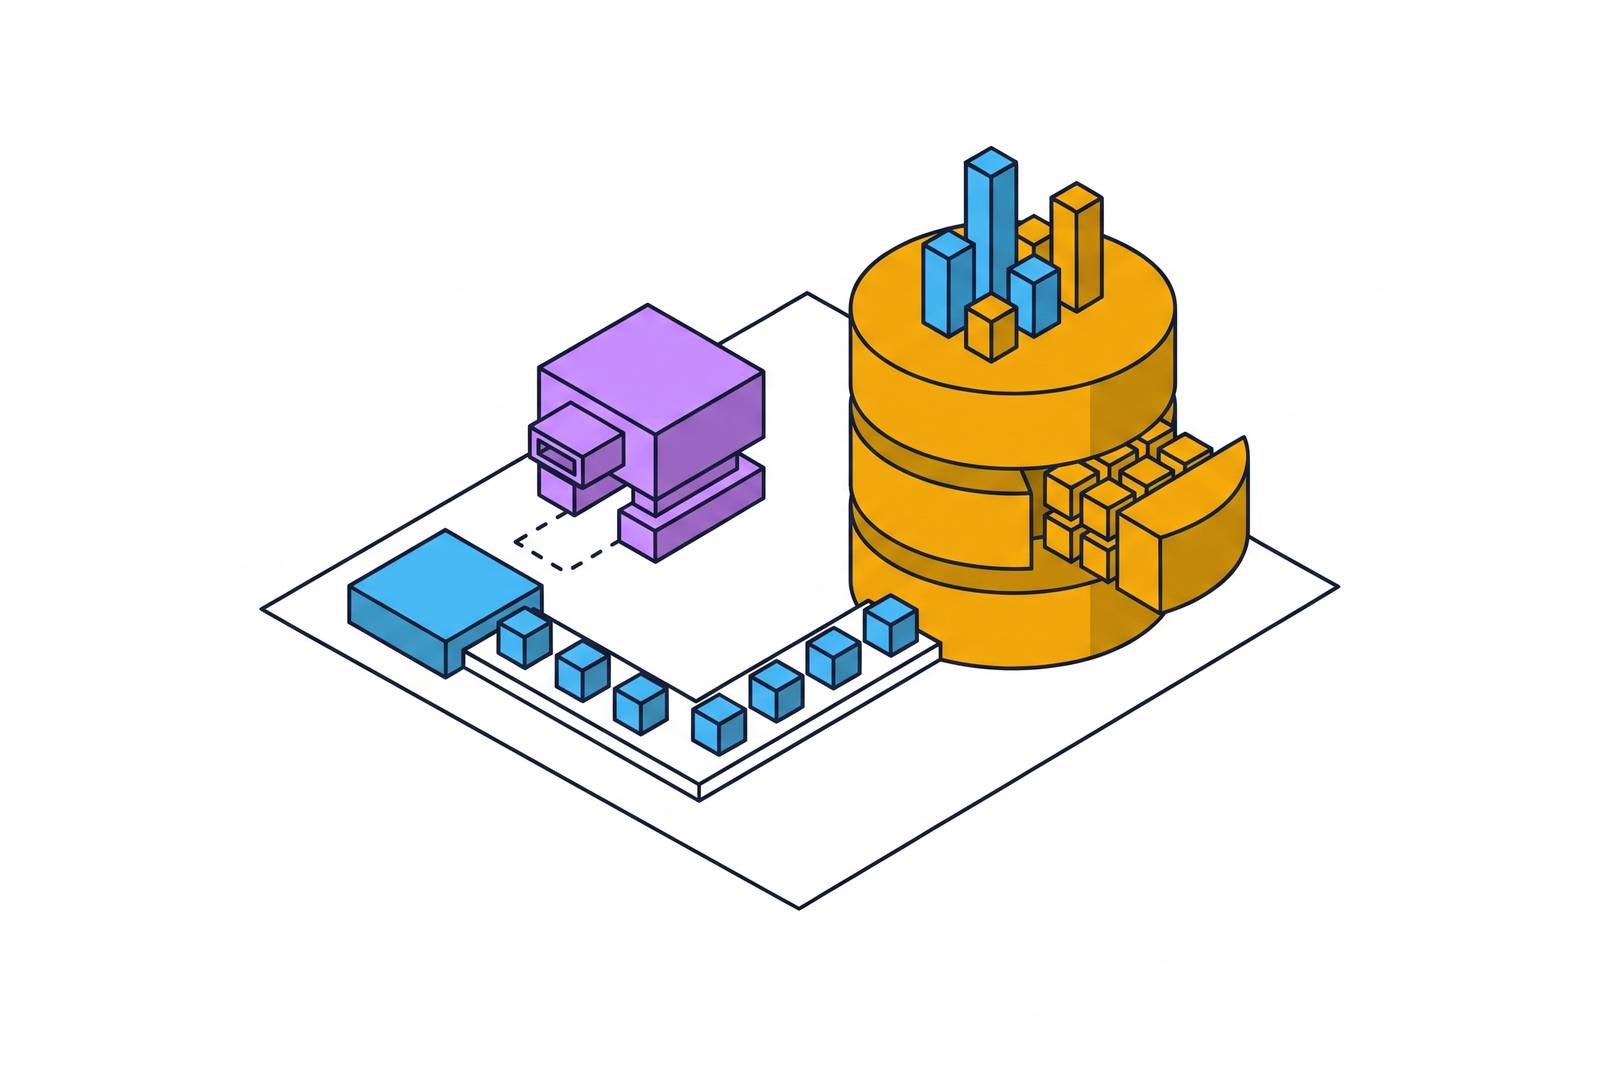
For Supabase teams, replacing an analytics SDK with direct Postgres event queries keeps business metrics tied to the database that records application activity. Direct SQL is sufficient for many early-stage dashboards, provided the event schema is reliable and analytical load is measured. As demand grows, the practical path is a governed analytical layer that serves humans and agents without creating competing definitions of business truth.
Why bolting an analytics SDK onto Supabase creates a second source of truth
Adding an SDK is fast and frictionless. A CDP like Segment, or an analytics SDK like PostHog or Mixpanel, routes events into a parallel store with instant dashboards and no initial schema design. The hidden cost is that the store is a copy, while the application’s records remain in Postgres.
That separation creates room for definitions to drift. One engineer writes SUM(revenue), while another writes SUM(amount_captured). By the time an investor asks for audited numbers, Q2 revenue can depend on which system answers. The team has allowed two calculations to represent the same business metric.
The discipline is to define business metrics once. Calculating them from the database the application uses keeps users, subscriptions, cancellations, feature usage, and revenue events connected to their operational records. It also avoids sending personally identifiable data to unnecessary external platforms. An SDK can still earn its place, but convenient collection is not a substitute for an agreed source of truth.
What Supabase's architecture actually gives you to query analytically
Supabase provides hosted PostgreSQL, authentication, real-time subscriptions, file storage, and Edge Functions. Its Postgres foundation makes signups, activation, revenue, and feature adoption queryable in SQL without a separate pipeline. The SQL Editor executes those queries directly against production. It suits ad-hoc developer work. Teams cannot save queries as auto-refreshing charts there, teammates who are non-technical still need SQL, and there are no built-in threshold alerts or workflow triggers.
Supabase’s other analytics surfaces serve different purposes. Logs and Analytics, powered by Logflare, provides operational visibility into services, such as debugging a slow endpoint. Analytics Buckets provide Iceberg-backed columnar storage populated by the team’s own ingestion pipeline. The Iceberg Foreign Data Wrapper bridges Postgres and those Iceberg tables so the stored data can be queried from Postgres. Neither of these gives a founder or PM the business dashboards and recurring metrics they need.
The wrapper has two setup paths, namely the Dashboard UI and manual SQL installation. The recommended Dashboard path starts on the Analytics Bucket page, where the team selects a namespace and clicks “Query with Postgres”. Entering a schema name and clicking Connect completes that path.
The four ways querying production Postgres for analytics breaks predictably
A BI connection can work before its costs emerge. The first mismatch is row-level security, which usually sets the application’s rules for who can see what through auth.uid() and per-user access. An analytical service account that needs to scan every row does not fit that model. The workaround becomes either a role that bypasses RLS, creating a security exception the team owns, or analytics-shaped policies embedded in production authentication.
The second mismatch is the connection path. Supabase routes connections through a pooler, and analytical scans hold connections open far longer than transactional queries. Those scans compete with application traffic for a finite pool. A query can therefore be valid SQL and still be a poor production neighbor.
The third mismatch sits inside flexible JSONB columns. Drag-and-drop charting tools struggle to read them, so analysts have to write their own extraction queries. Slightly different extractions produce slightly different numbers, recreating disagreement inside the same database. The fourth mismatch is compute. Row-oriented Postgres serves fast lookups, inserts, and updates, while analytical scans aggregate large swaths of rows and compete with live traffic for CPU and memory.
As the event table grows and dashboards slow down, upgrading the primary pays for analytical work. A read replica separates that work but runs the same compute size as the primary and bills separately, without plan compute credits, plus disk at 1.25× the primary’s size. In practice, that roughly doubles database spend. A read replica still has to deal with row-store scans and JSONB, and on its own it cannot join that data to Stripe or CRM data.
What an event schema in Postgres must get right before queries can be trusted
For teams choosing direct queries, correctness begins at ingestion. The user ID must be nullable, without cascade deletion of events. An event must outlive the account that produced it, because deleting historical events changes funnel numbers retroactively. Nothing has to fail visibly for the history to become unreliable.
The second requirement is a unique idempotency key on client_event_id. Frontend retries are normal behavior. Without a unique constraint, retries duplicate events and distort conversion and feature-adoption counts, as well as metrics derived from those events. How far the counts drift depends on network conditions. To add the constraint later, the team has to deal with duplicates already in the table through a migration that also changes the historical numbers.
The table must also remain an append-only log. Rows are written once and never updated, preserving the raw record from which historical metrics can be reconstructed. A state table answers what is true now, while an event log preserves what happened. Before trusting a dashboard, the schema review should establish a nullable user foreign key without cascade deletion and a unique client event idempotency key, with append-only writes preserving both decisions over time.
Where direct Postgres event queries are the highest-leverage move and where they stop being enough
Direct event queries do the most for a team before product-market fit. A pre-seed startup with a small number of events each day can answer basic product questions without streaming architecture, many layers of dbt staging models, or orchestration tooling. Simple ingestion and SQL can support counts and cohort retention through product-market fit validation. MRR, churn, retention, and feature adoption can use the same database as the application, keeping their reports together.
PostHog uses ClickHouse because funnel analysis over millions of rows in standard PostgreSQL can be genuinely painful. Complex, multi-join funnels across hundreds of millions of rows call for more than the counts a team needs at an early stage. That architecture exists for a reason. Recognizing its value does not mean every team needs it at launch.
The boundary is a workload condition. It arrives when event volume and query complexity exceed what materialized views, read replicas, and good indexing can serve without competing with production traffic. Most early-stage teams encounter the product-market fit challenge first. When analytical demand does cross that boundary, Analytics Buckets and the wrapper provide an extension path rather than requiring Postgres to be abandoned as the source of truth. Storage and query execution can change without creating independently defined business metrics.
Why observability on the Postgres instance must come before analytics decisions
Upgrading compute, adding a replica, or moving analytical work to a bucket requires measurements of the primary under load. A Supabase project should have a Postgres exporter, Realtime Prometheus metrics, and structured logging from day one. Retrofitting instrumentation after a slowdown leaves the earlier architectural decisions unsupported.
The key analytics signals are p50/p95 query latency on the primary. Latency dashboards make it possible to distinguish slow analytical queries from slow application queries and assess whether better indexing could avoid an upgrade. The team needs to check those signals alongside analytical load and how much CPU is in use when application traffic is at its peak. A dashboard that feels slow is a symptom. Measurements showing that analytical queries consume a disproportionate share of production resources are a basis for changing the architecture.
How agents querying your analytics surface change the access pattern requirements
A misconfigured agent can keep connections open until the pool saturates, degrading the application for real users. Unlike a human analyst, it has no instinct to close a tab when a query is taking too long.
An agent with write access to a table it should only read can corrupt the numbers it is supposed to report. The team should use a governed analytical copy with pre-modeled, pre-calculated datasets and a layer that controls access to them. Agents should never run queries directly on the production instance. This copy differs from a competing source of truth because its definitions remain governed rather than being reinvented in a separate reporting system.
Containment can be organized into three rings. The inner ring restricts data scope through row-level security and gateway-mediated database access. The middle ring distinguishes read-only, reversible, and irreversible actions, while the outer ring requires human approval for actions that threaten containment boundaries. Credentials need their own limits as well. Giving each agent its own service accounts and using short-lived machine-to-machine OAuth credentials in place of static API keys limits how much harm it can do if it is compromised or misbehaves.
MCP as the access layer between agents and a governed Postgres analytics surface
The Model Context Protocol supplies a structured access layer. Tools let agents do things such as run a governed query on a pre-calculated dataset. Resources provide schemas and governed dataset definitions that constrain what the agent can ask. Prompts encode reusable analytical workflows so an agent does not rediscover how MRR is calculated each time. These primitives expose the quality of the underlying model, including its defects.
The 2026-07-28 specification revision made MCP stateless at the protocol layer. Requests can reach any server instance behind a round-robin load balancer, making horizontal scaling more straightforward for concurrent agent traffic. More MCP servers cannot fix pool exhaustion if their queries still hit production Postgres. The governed analytical copy must come first.
Informatica announced native MCP support across its Intelligent Data Management Cloud at Informatica World 2026, with servers live or in preview across AWS, Microsoft Foundry, Databricks Agent Bricks, Snowflake Cortex AI, and Salesforce Agentforce. The U.S. National Security Agency’s May 2026 report noted that MCP’s rapid proliferation had outpaced development of its security model. Adoption is not a security guarantee.
For a Supabase team, the practical pattern is pre-modeled Parquet datasets queryable through DuckDB and exposed through an MCP server. This keeps agents away from production while allowing dashboards and agent queries to use the same definitions. The pattern described here requires no ETL pipeline or production schema changes. It is distinct from Analytics Buckets, which require the team’s own ingestion pipeline.
How do you get analytics and dashboards for your Supabase project without a data team?
A small team can implement this in stages. Begin with an event table with a nullable foreign key, a unique idempotency key, and append-only writes. The team should also set up observability at the start, using the exporter, Prometheus metrics, and structured logging to gather measurements for later decisions on when to scale. Direct Postgres queries can then supply MRR, churn, retention, and feature adoption while latency signals show that production can support them.
When choosing a reporting tool, the team should look for recurring dashboards, JSONB extractions that work the same way each time, an access model that does not casually bypass production RLS, and a query path that does not overload application connections. A direct Supabase connection alone does not answer those questions. The dashboard is the presentation surface, and trusting it requires reliable metric definitions and workload isolation.
When analytical demand warrants extension, the next stage is Analytics Buckets accessed through the wrapper, with Postgres retained as the source of truth. Before adding an agent that needs metrics, the team should make pre-calculated datasets available through a governed MCP access layer. A seed-stage SaaS startup can implement this approach in a few weeks, answering most investor and team questions through dashboards and reducing the need for one-off engineering requests.